Normally, winter is the wettest season in most of southern California, especially December through March. Whether we have a wet winter or a dry winter, one thing that occurs in most winters in southern California: long dry periods. We just went through one before the rain arrived late Tuesday (10 Feb) or early Wednesday (11 Feb), depending on where you are; note the deserts mostly missed out on the rain. San Diego International Airport (SAN) received 0.23" (9 mm), while Los Angeles International Airport (LAX) received 0.64" (17 mm).
So has this dry spell affected our seasonal precipitation? Not substantially. Below, I will show how other winters compare, but first, here is a map showing "water year" precipitation percentage of normal to date (note that the "water year" is defined by the United States Geological Survey as being from 1 October through 30 September of the following year (so we're currently in "Water Year 2026" which extends from 1 Oct 2025-30 Sep 2026; this offset from the calendar year or the traditional California 1 July through 30 June period is because stream levels are typically lower in many parts of the US around September or October, and snowfall in the mountains, which is an important part of the western US water supply, mostly hasn't gotten started yet). I think the water year generally meets our needs here for "season to date" precipitation, though once in a while, we get substantial precipitation before 1 Oct, such as with former Hurricane Hilary in 2023, which can have major impacts on the fire weather season in autumn. Anyway, back to The map: it is from the California-Nevada River Forecast Center (CNRFC, part of the National Weather Service) website, which can be found at https://www.cnrfc.noaa.gov/?product=QPEWYPercentNormal&PNGtypeID=QPEWYPercentNormal.
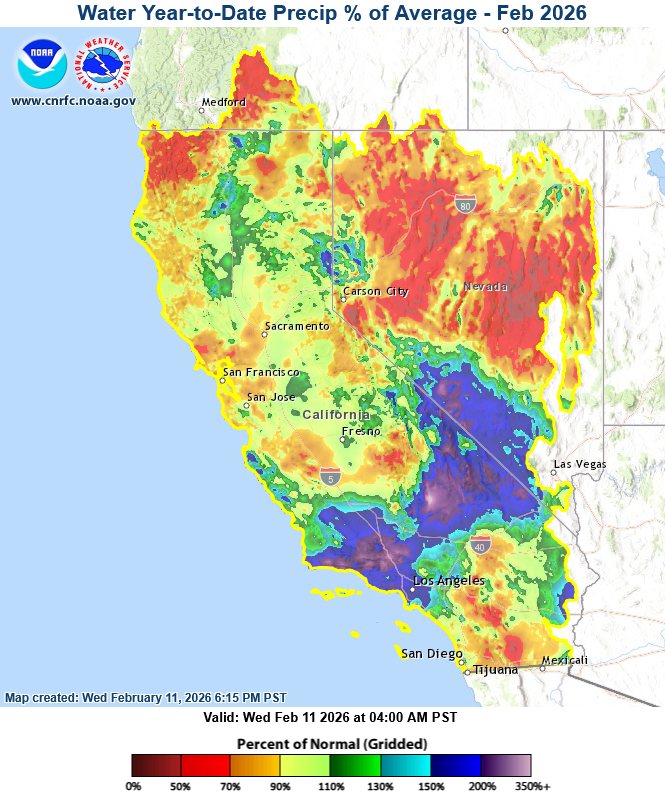
As you can see, a lot of the area from Santa Barbara and Los Angeles northeast through Death Valley and into southern Nevada (note that CNRFC doesn't include Las Vegas proper in their map) is still very well above normal (in some areas more than twice of normal) for precipitation since 1 October. Down around San Diego, it's mostly around normal (as is many other parts of California), though the mountains and some desert areas are notably below normal as a lot of our big storm systems (with atmospheric rivers) were focused a little bit farther northwest. That is all despite the dry spell of more than one month.
Here is a different type of graph that some of you probably haven't seen. This is a graph showing how much precipitation had fallen since 1 Oct for all of the past 30 years (including 2025-2026 which is shown in bold black) up to a given date. I stopped the graph at April since in most of Southern California, little precipitation falls after that. In the graph, the flat lines show the periods when no rain has occurred, but where the lines are almost vertical illustrate the periods of heavier rainfall. This sort of "horse race" graphic is for San Diego (SAN):
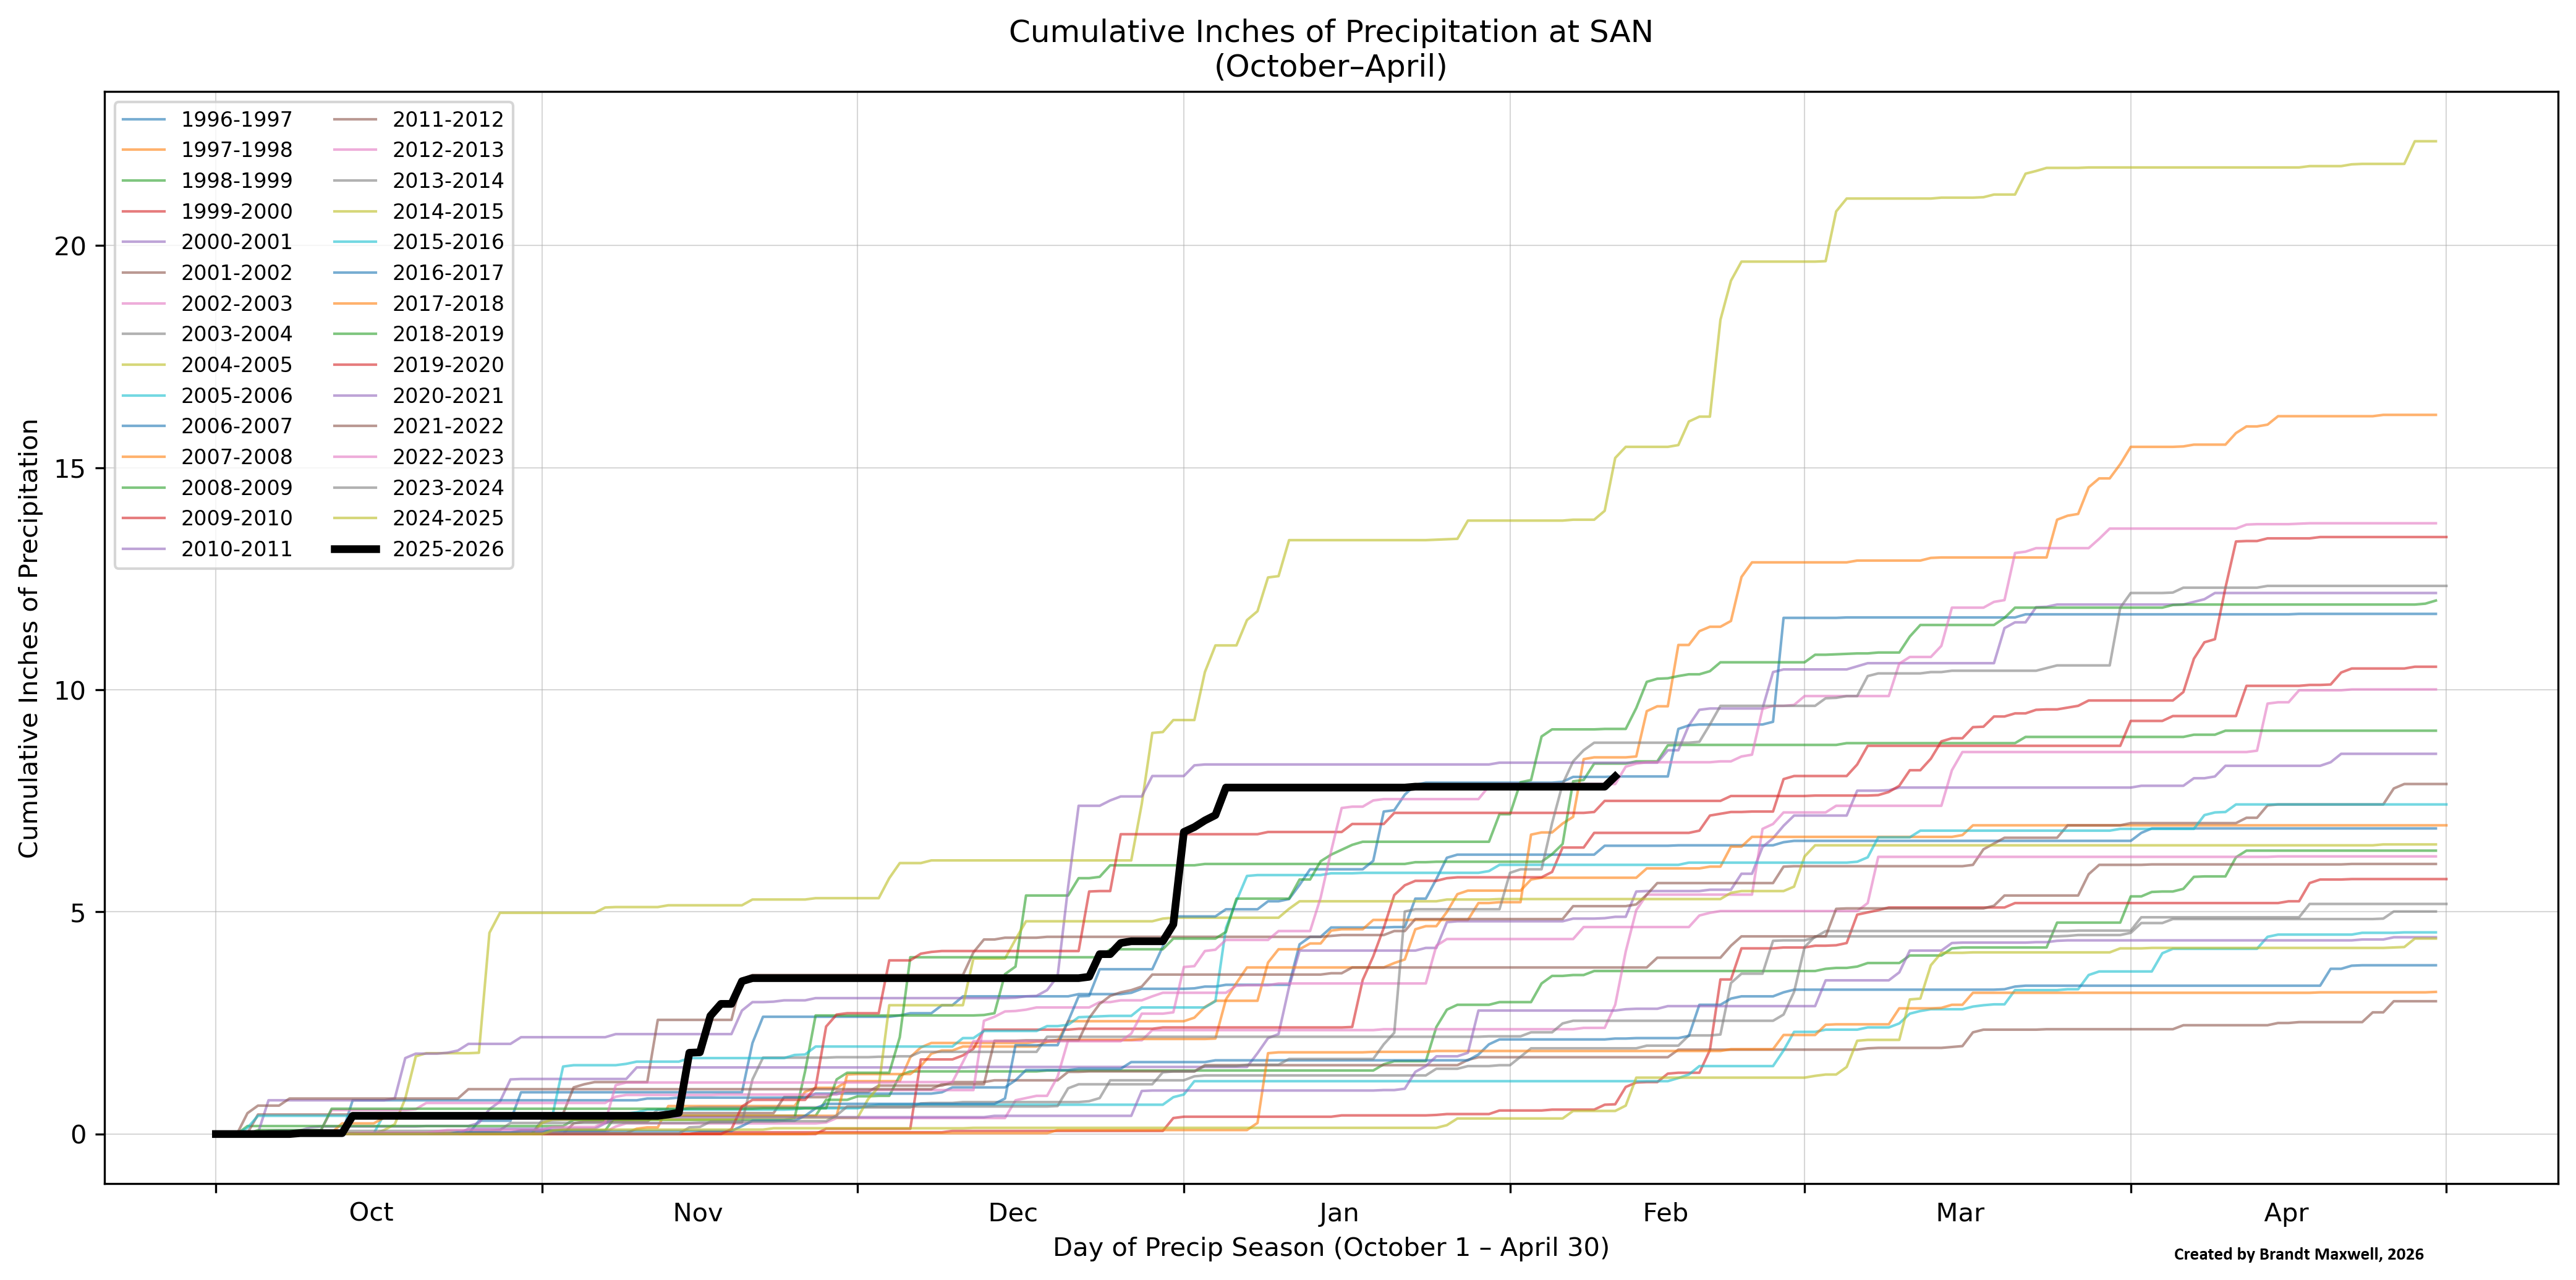
At one point in late November, we were #2 (compared to the years since 1996, 30 years ago) because of plentiful rains in mid-November, and we were #3 as recently as mid-January. As of today, we are #7, and officially at SAN, with 8.05" (2.35" above normal). Note that SAN got a bit "lucky" compared with even other parts of town (San Diego Montgomery Field, MYF, has actually had less rainfall despite being about 400 feet (120 meters) higher in elevation with 6.60" since 1 Oct 2025, only 0.34" above normal). You can't really tell which year each line represents easily (which isn't really the point here), but the highest line (thin green line) represents the very wet 2004-2005 season when 22.35" (568 mm) fell from October through April, while the thin purplish line represents the very dry 2001-2002 season when SAN fell just short of 3" (76 mm) from October through April. (Note that the x-axis just shows the month and not dates for less clutter and my perception of easier reading, but late November would be on the right side of the November part of the graph.)
Next up, LAX:
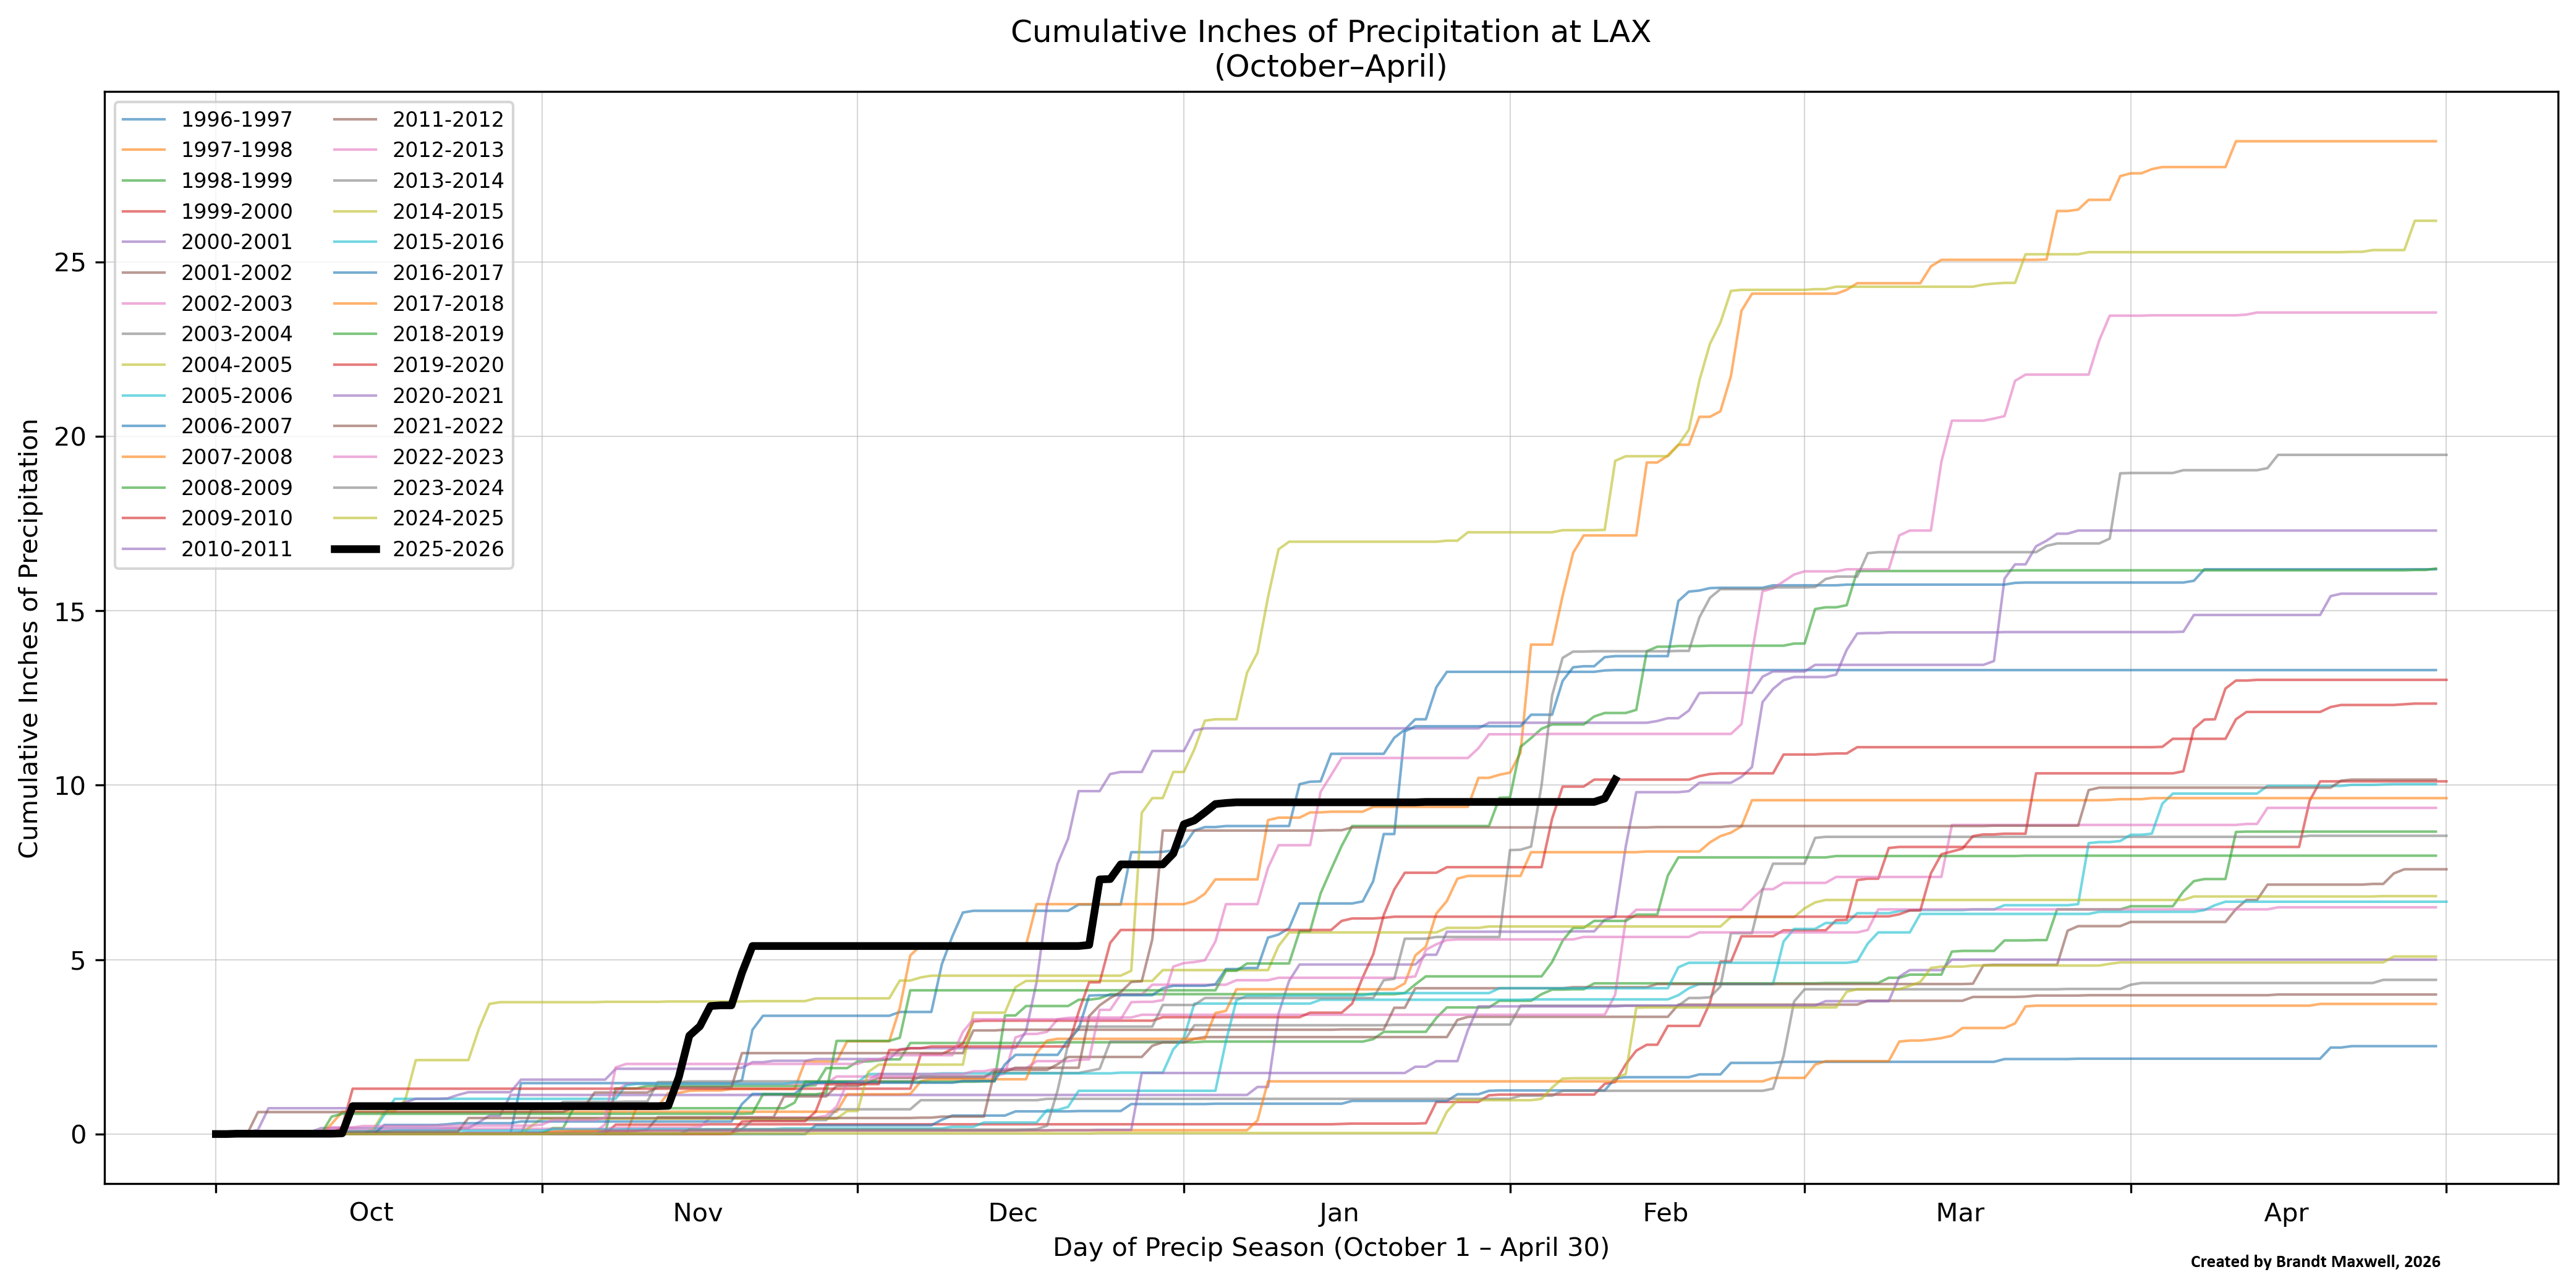
This is similar in a lot of ways to the graph for SAN with the wet periods separated by the notable dry periods. LAX had their wettest season-to-date (albeit short at that point) precipitation in the past 30 years for a while in late November and early December but is now #9.
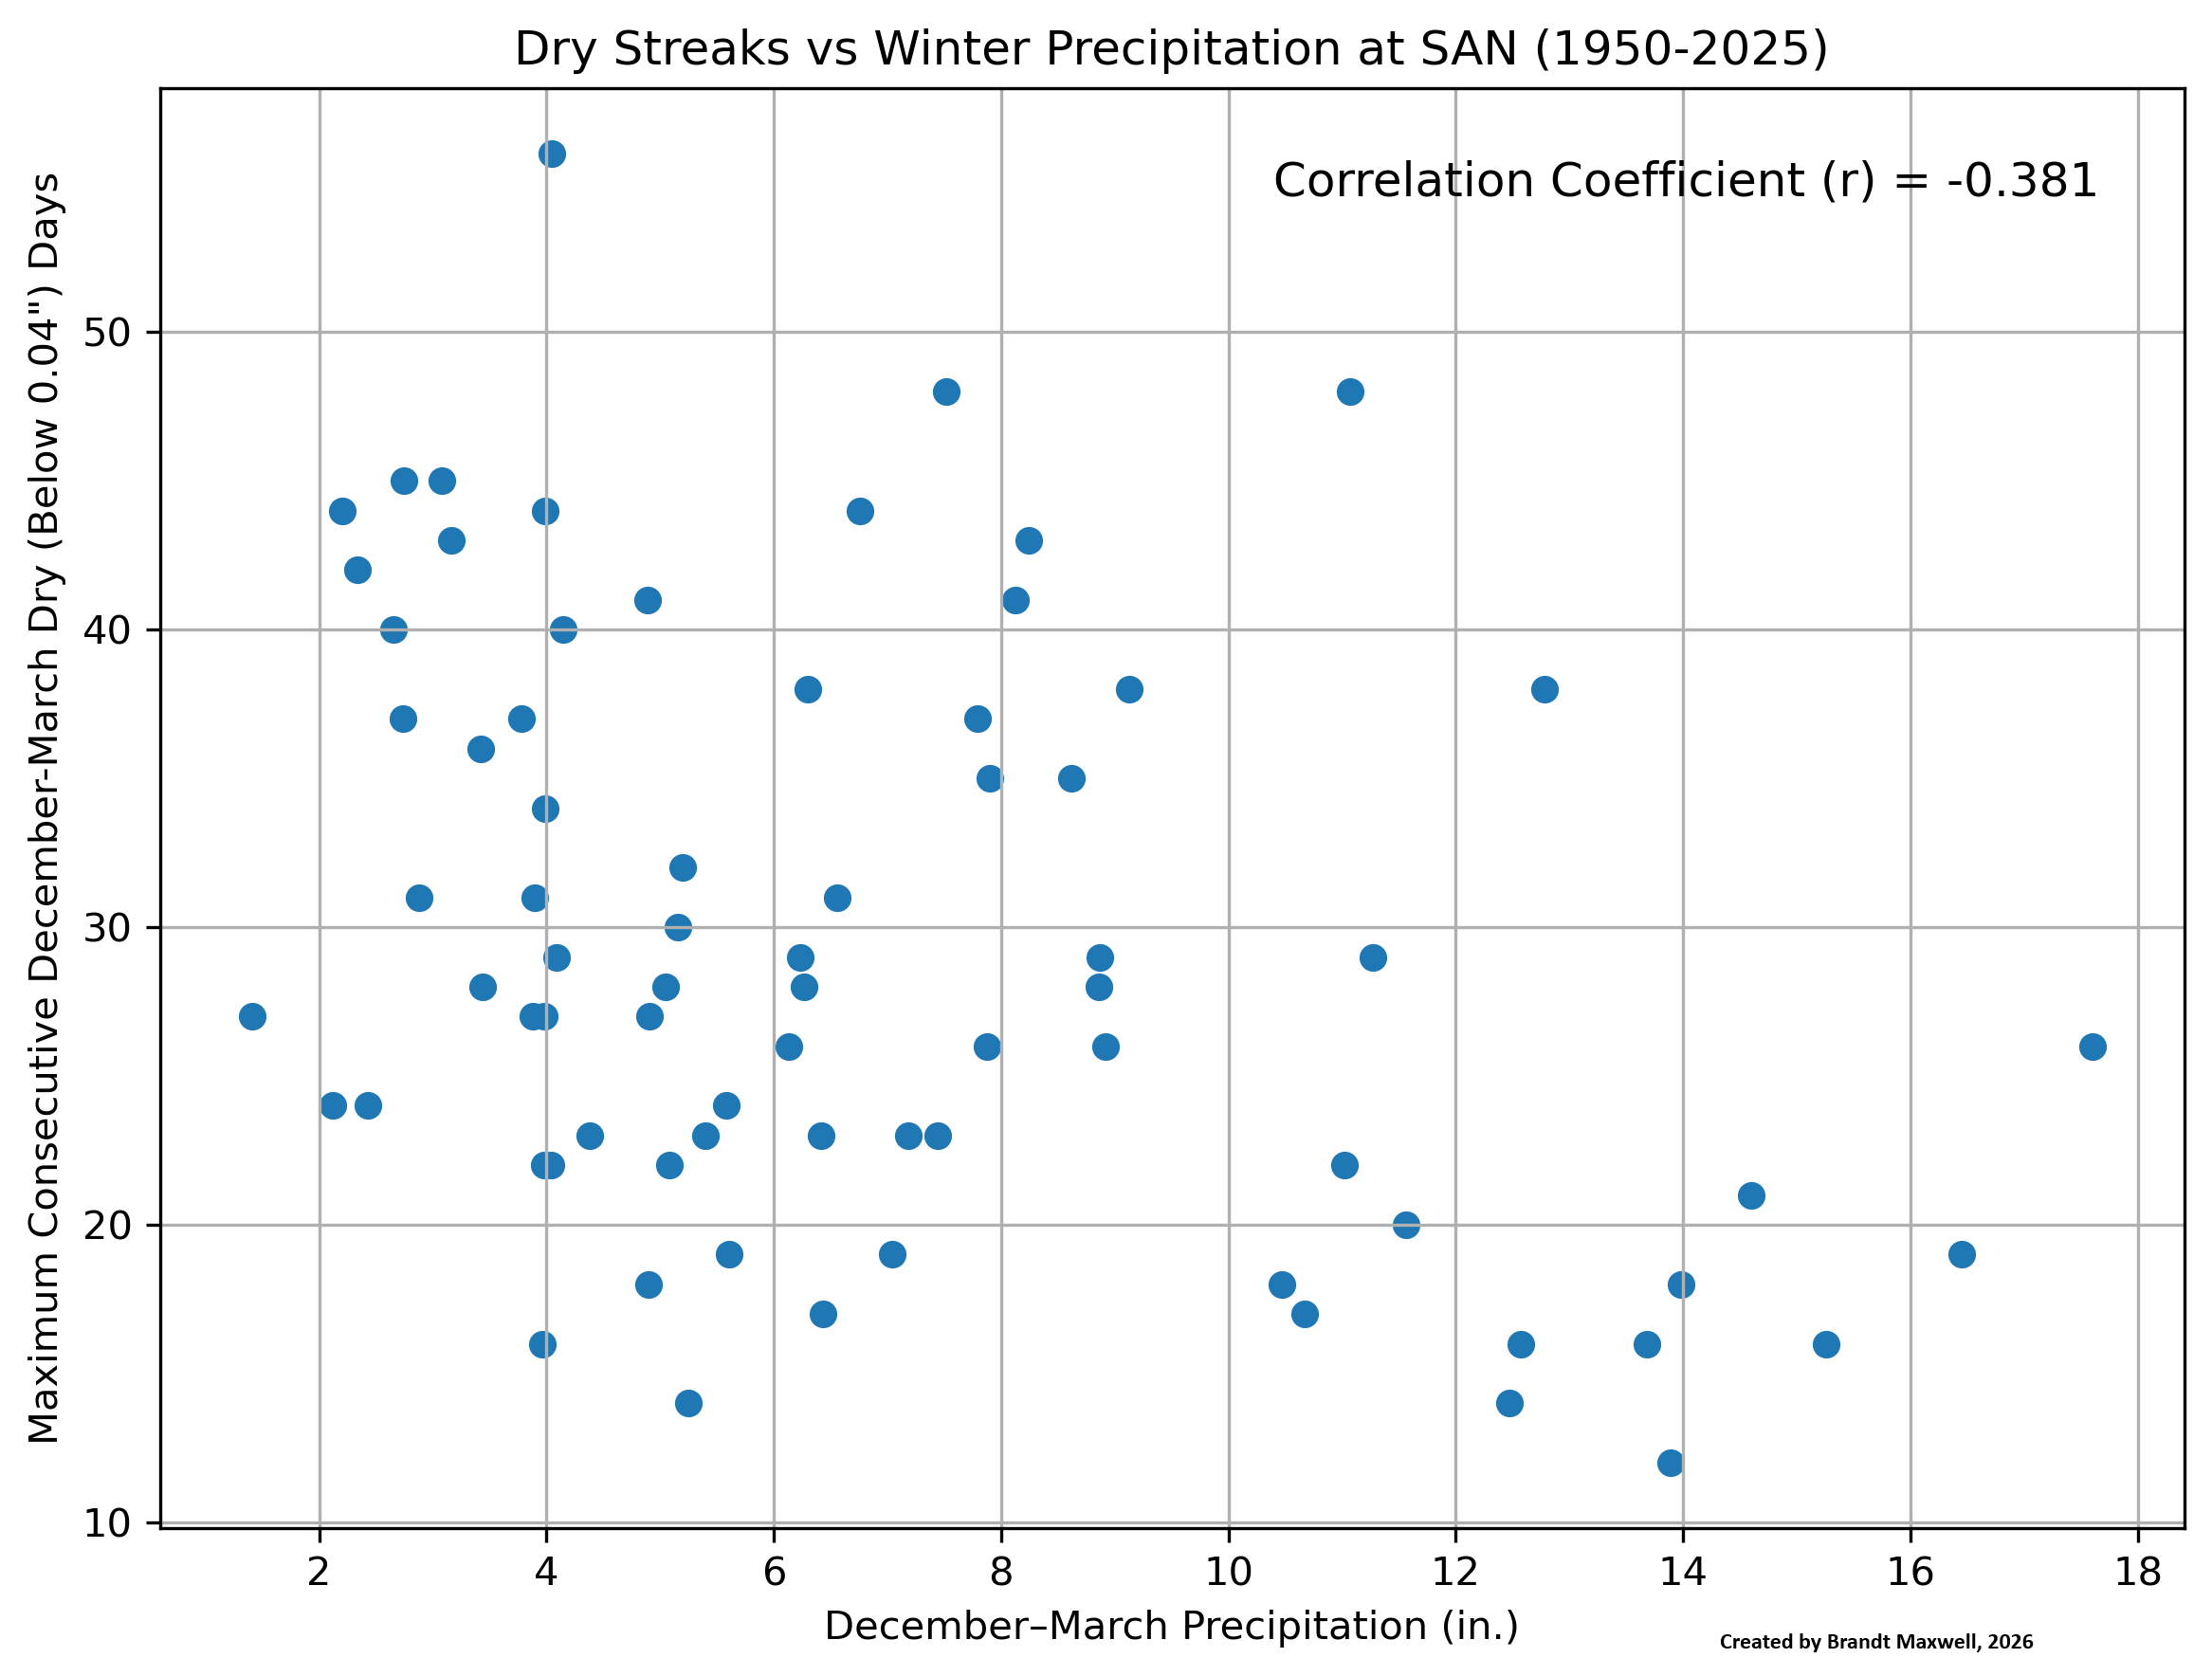
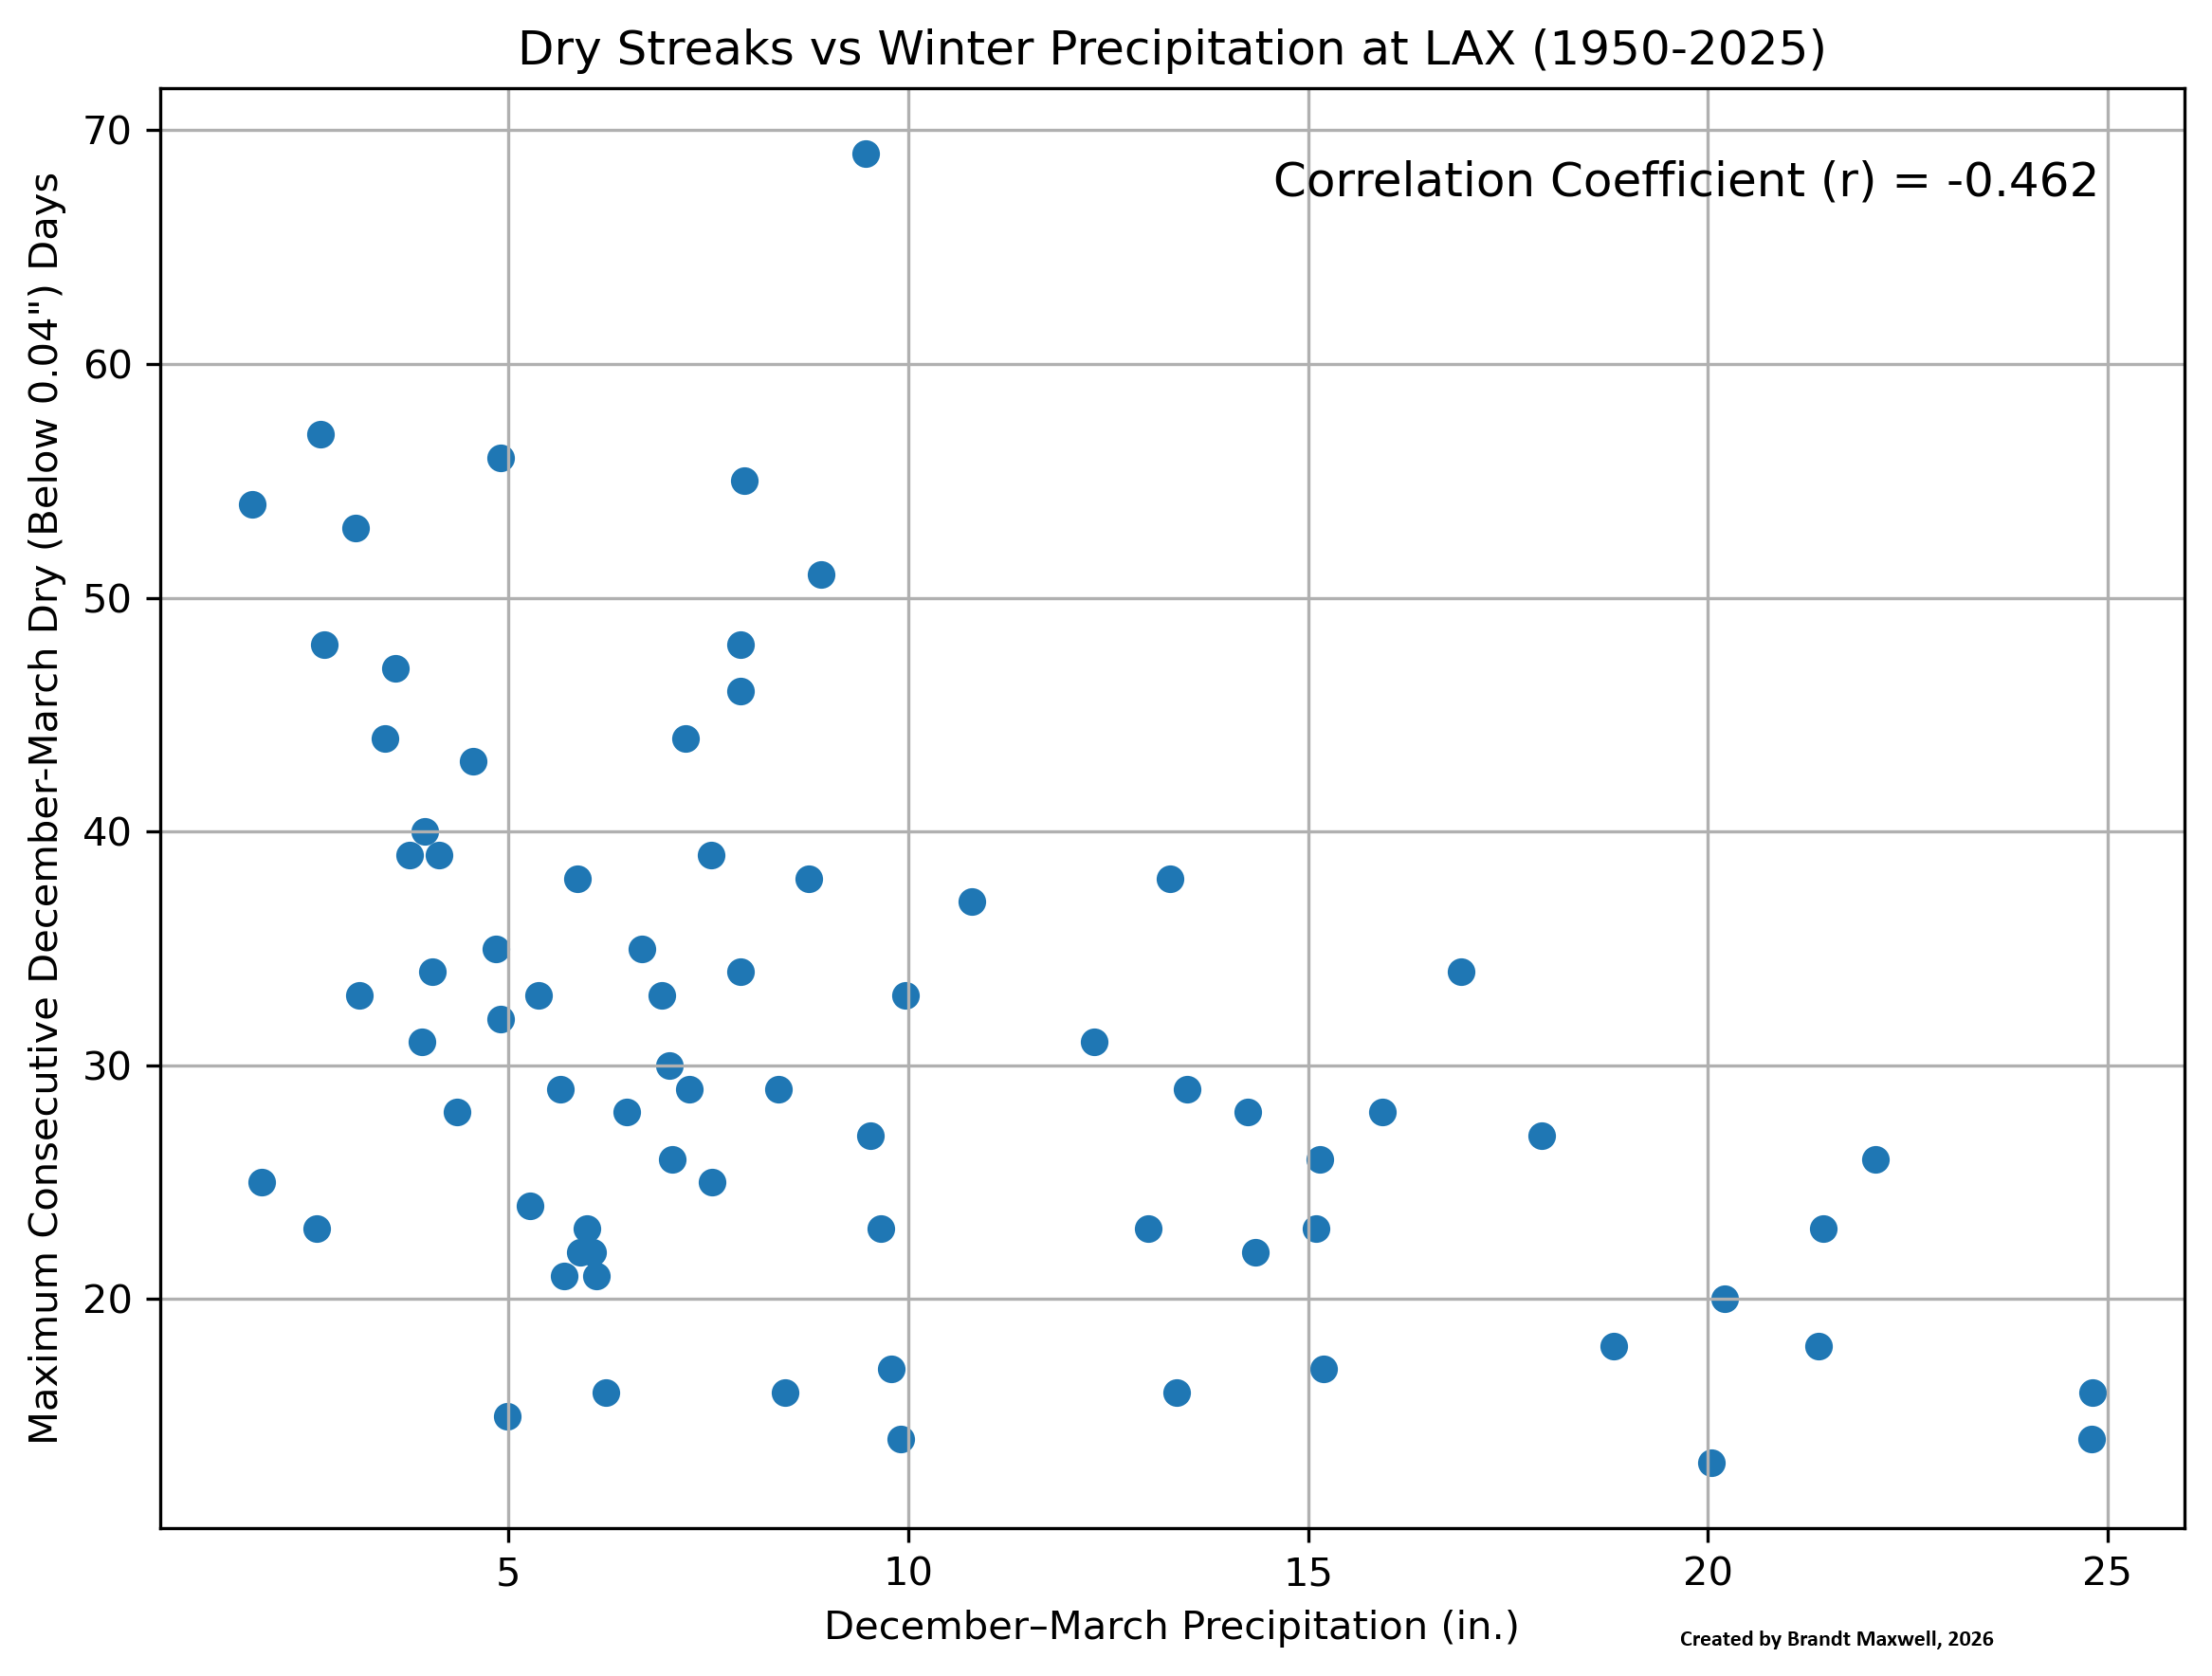
What are the longest dry spells during winter? In this study, we will only look at the number of days between December and March (inclusive) in dry spells as rainfall is less frequent and less reliable (not that it's ever really reliable in southern Calfornia) outside of those months. We will also go back to the winter of 1950-1951 (more data, since we won't have to worry about the clutter of the past two graphs) We will initially use 1 mm (0.04") as the threshold for a "wet" vs. "dry" day as described before (so 0.04" will break a dry spell):
San Diego Top 5:

Winter     Days  Dec-Mar Precip

2024-2025:  56   (4.05")
1985-1986:  48   (7.52")
1990-1991:  48   (11.07")
2005-2006:  45   (3.08")
2013-2014:  45   (2.75")

Average Dec-Mar Precip: 6.90" (1950-2025)

Los Angeles Top 5:

Winter     Days  Dec-Mar Precip
2021-2022:  69   (9.47")
1983-1984:  57   (2.65")
2024-2025:  56   (4.90")
1999-2000:  55   (7.95")
1960-1961:  54   (1.79")

Average Dec-Mar Precip: 9.25" (1950-2025)
Note that two of the winters with the longest streaks were above normal for precipitation at SAN and one was above normal at LAX. However, there were notable dry winters too with long dry streaks, such as 2005-2006, 2013-2014, and 2024-2025 at SAN and 1960-1961, 1983-1984, and (again) 2024-2025 at LAX. The amazing thing is that there was no daily precipitation at LAX of at least 0.04" between 18 Jan 2022 and 27 Mar 2022 (69 days) despite being slightly above normal for that winter (it helped that December had over 8" of rain--more on that situation in a bit!).
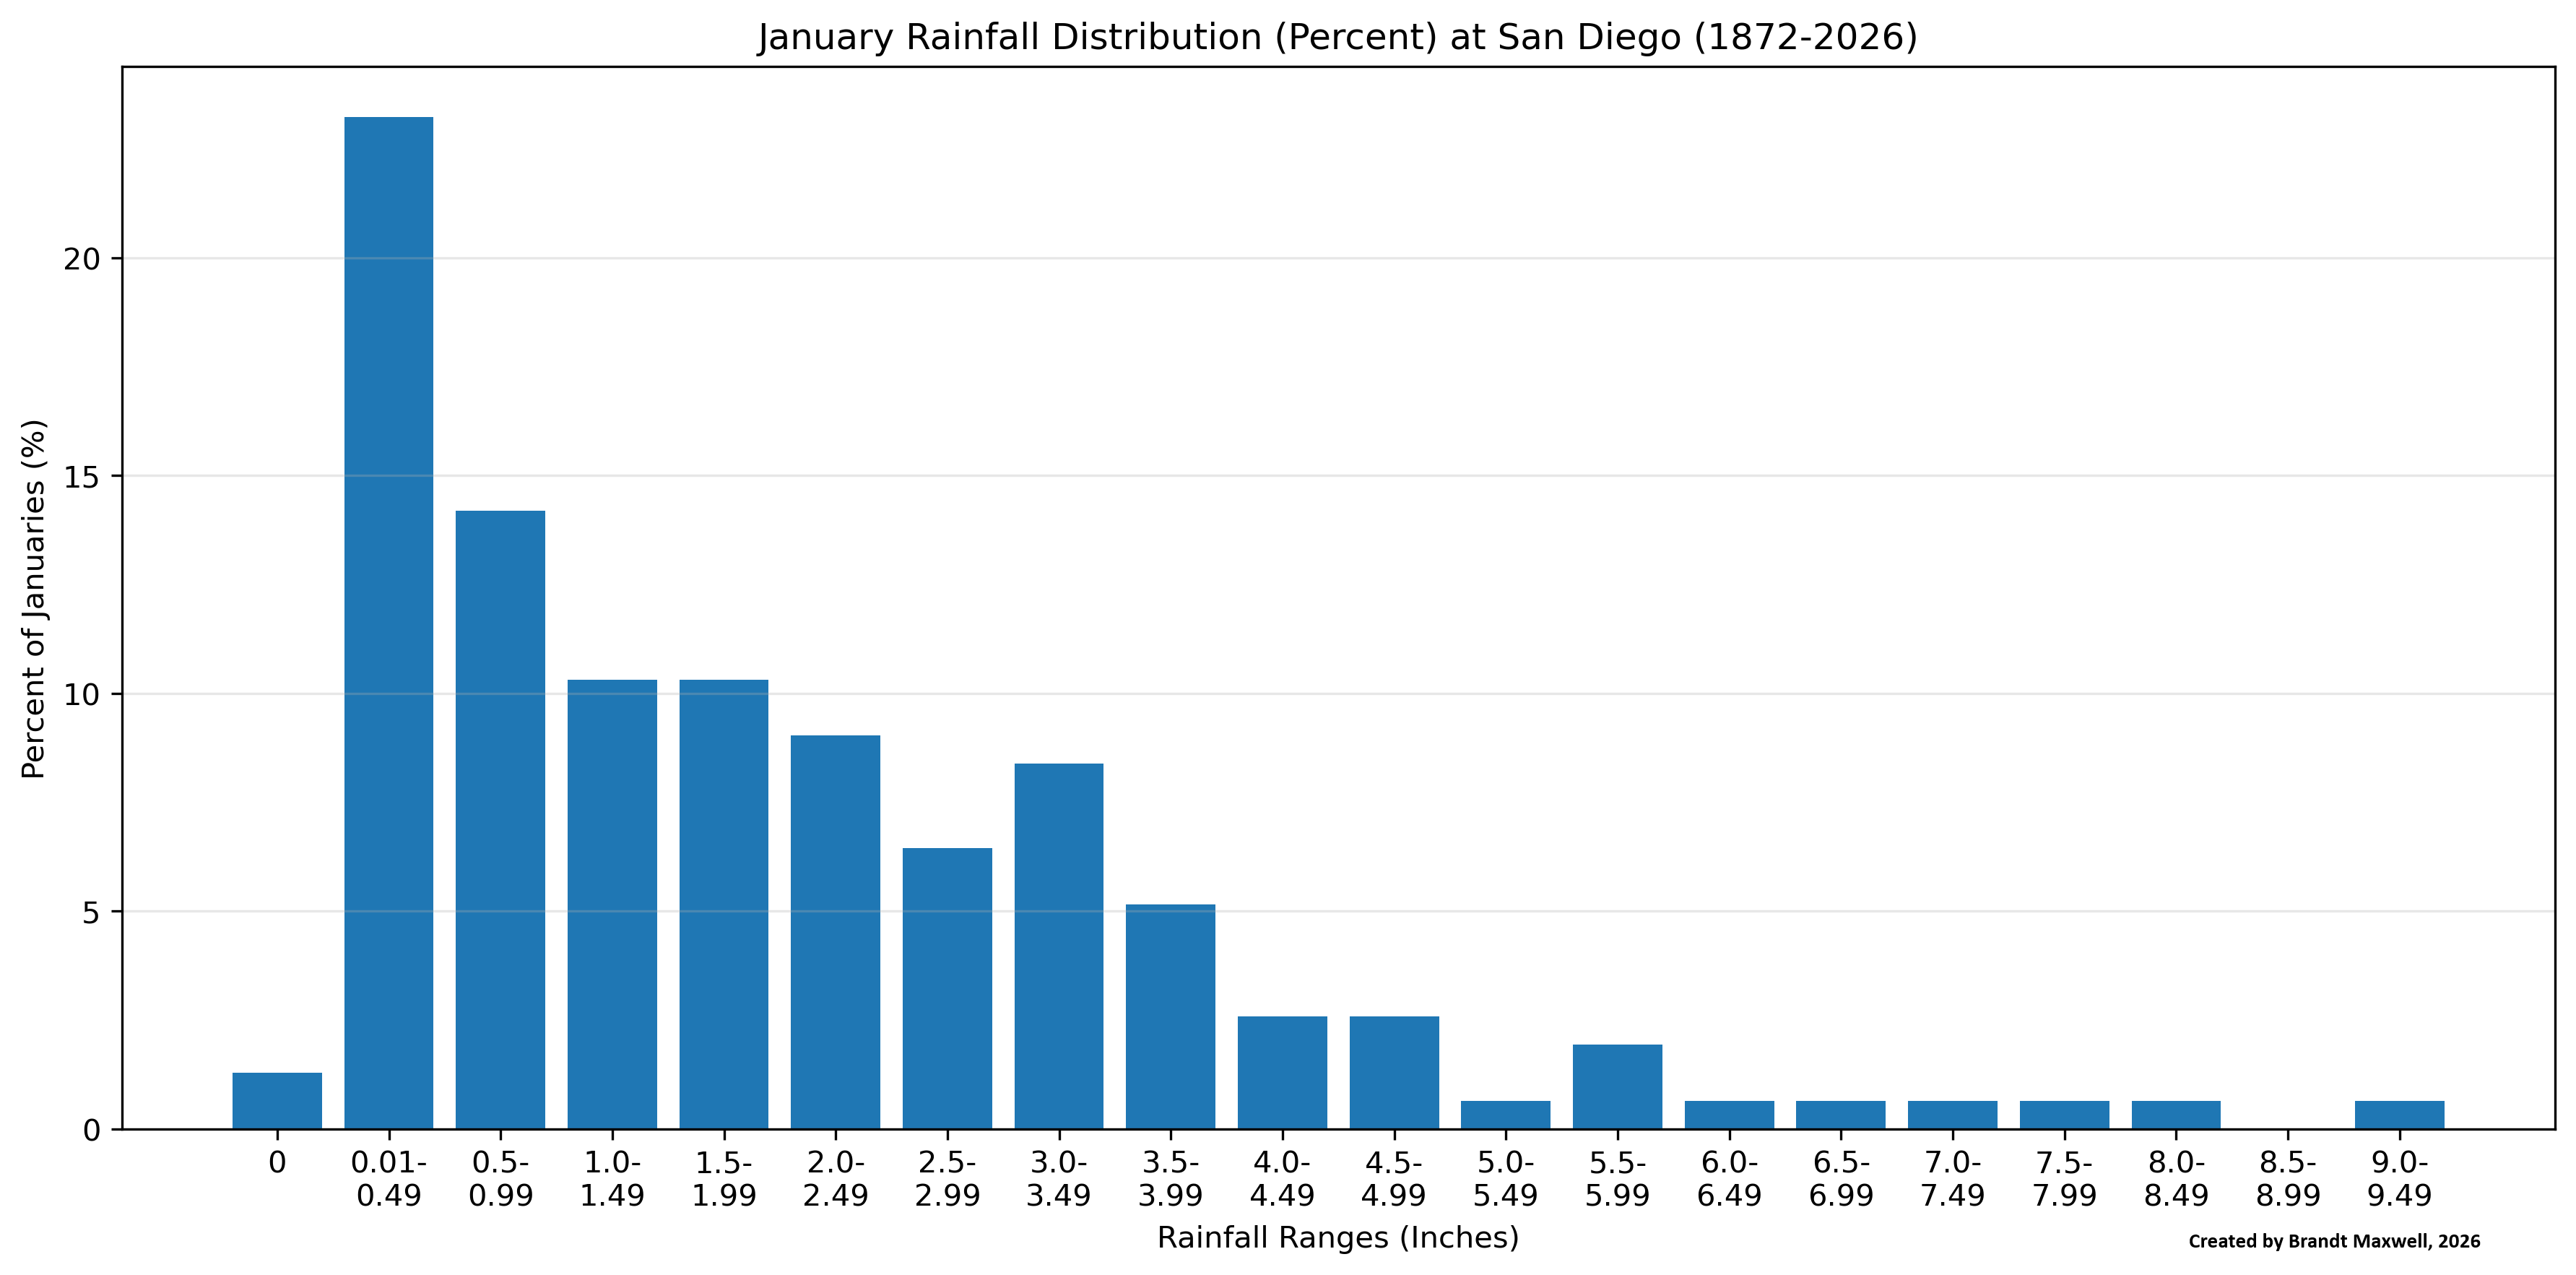
One can also look at the distribution of monthly precipitation, such as for January for SAN (going way back to 1872, when precipitation was measured downtown, versus the airport). Note that if one splits up precipitation into half inch increments, the most likely amount of monthly precipitation will be in the 0.01" to 0.49" range (and even a couple Januaries have had no measurable precipitation: 1948, 1976), even though the long-term average is just below 2 inches.
One of the important things with precipitation in southern California is how much can fall on so few of days, or in a short time period. I like this image from Michael Dettinger, retired hydroclimatologist from Scripps Institution of Oceanography, which shows if one were to pick out the wettest days of the year, how many would be required to reach half the annual precipitation, on average (Source: https://www.mdpi.com/2073-4441/3/2/445 (Dettinger, et al.: "Atmospheric Rivers, Floods and the Water Resources of California", Water, 2011, 3(2), 445-478):
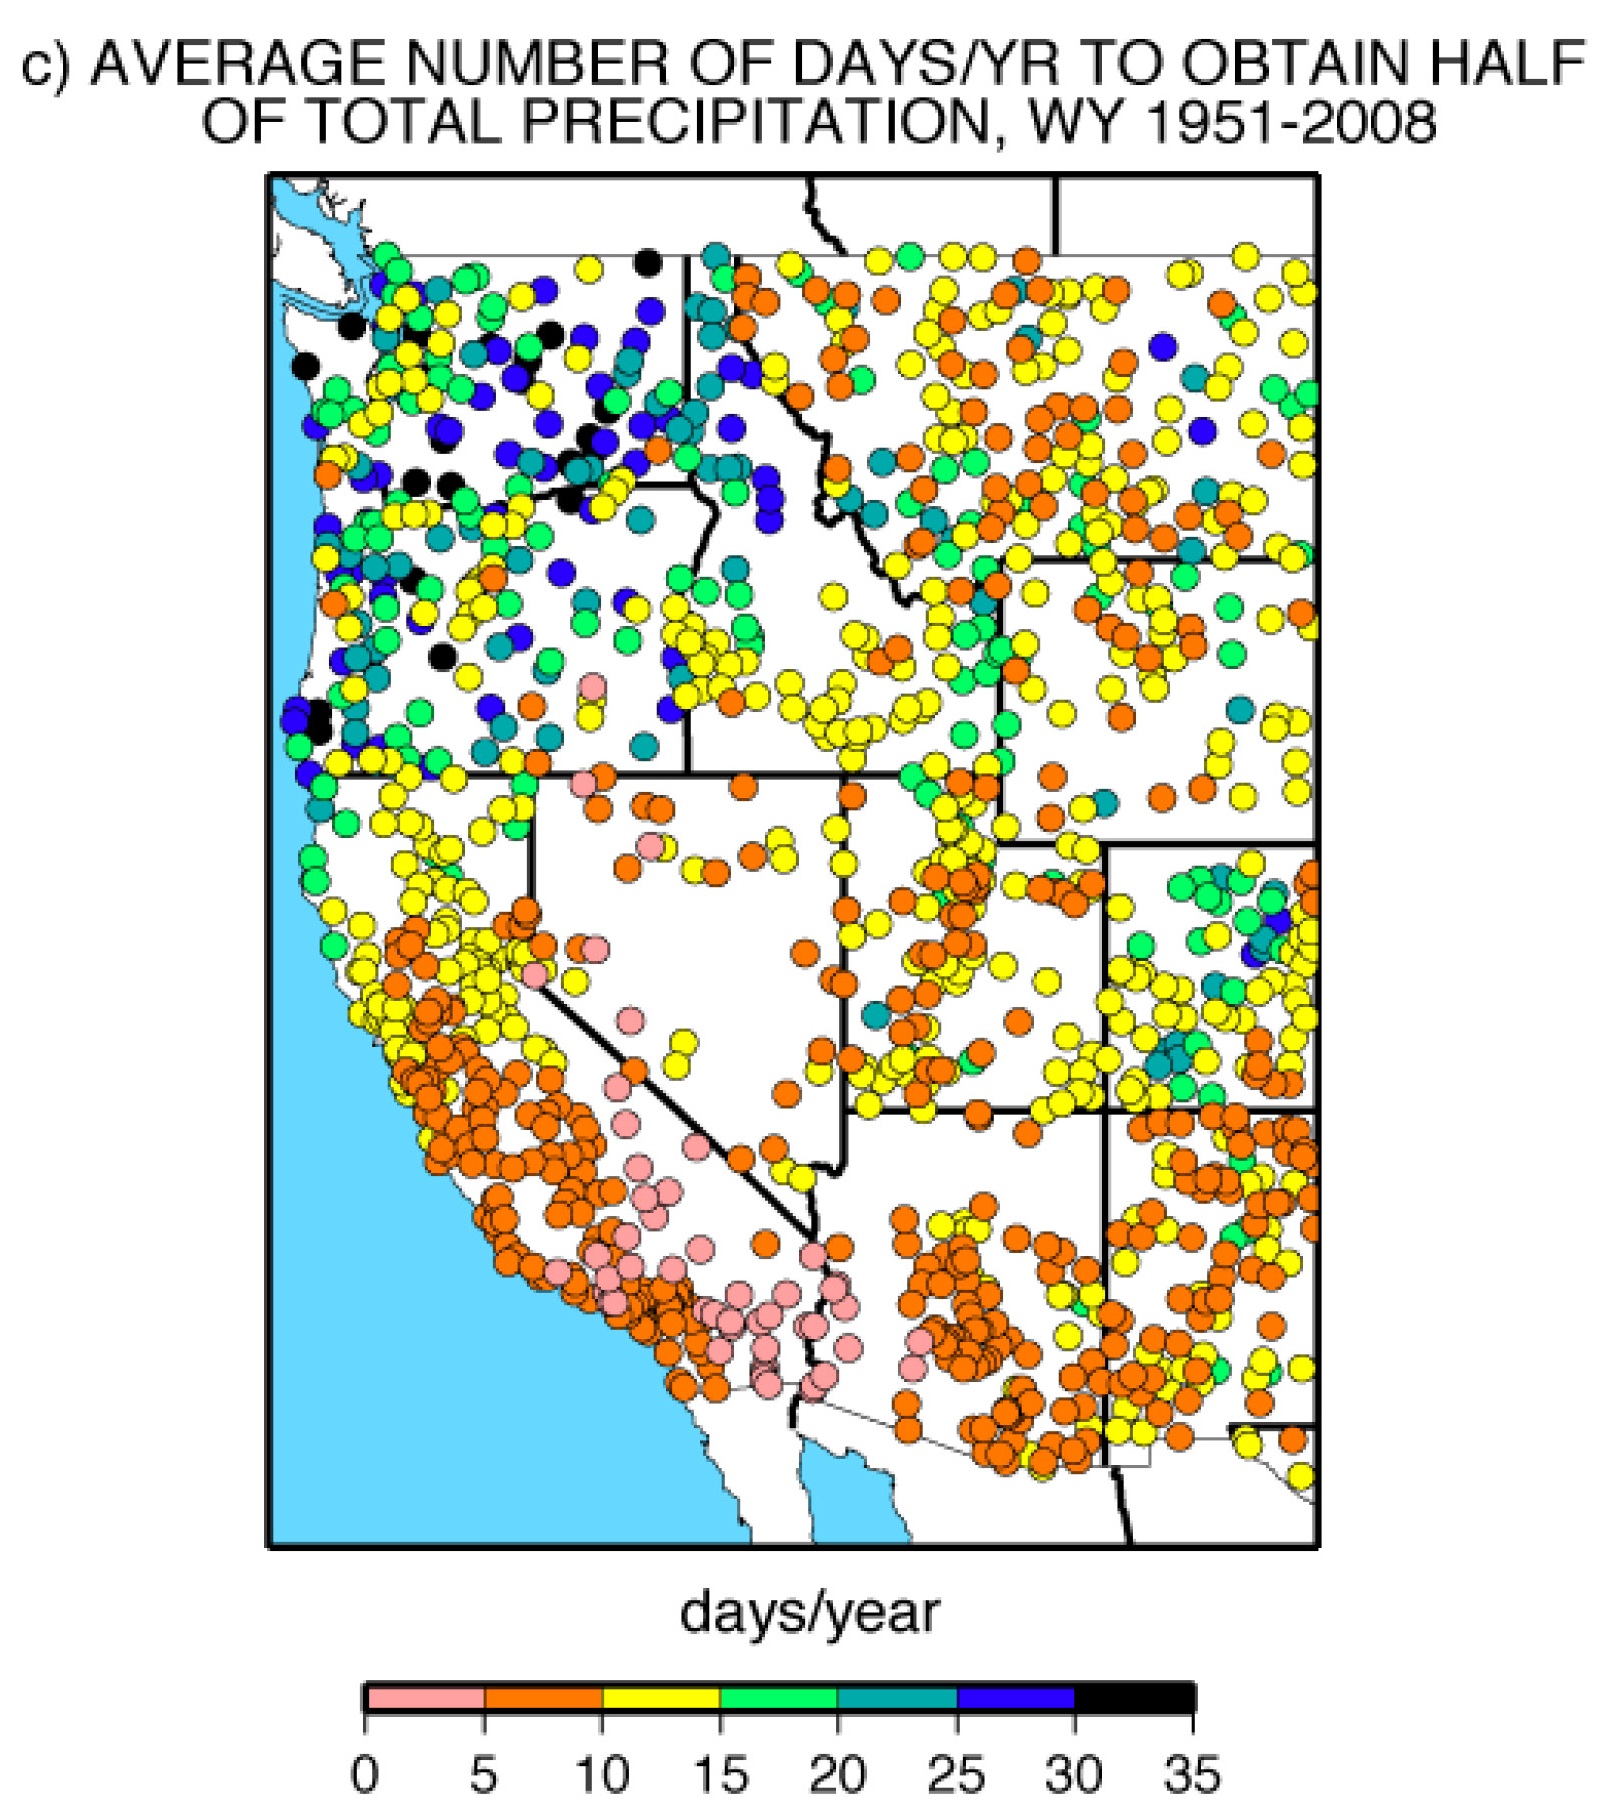
The wettest 5-10 days of the year makes up for about half of southern California precipitation (even less in the deserts). My calculations showed from 1950 through 2025, SAN had, on average, 5.6 of its wettest days making up half the annual precipitation (even though, on average, measurable rain occurred 41 days per year, with 29 days having at least 1 mm or 0.04"). LAX had, on average, 5.1 of its wetting days making up half the annual precipitation (with 34 measurable rain days per year and 27 with at least 1 mm or 0.04"). This is due largely to the atmospheric rivers, which are really important to the greater California water supply, and its effects are even more notable farther north in California and at higher elevations (I will feature atmospheric rivers, including their effects, in one or more future blog posts). I have long mentioned to people, including when I was at the National Weather Service, that just a small handful of storms (less than 5, especially if a storm lasts more than a day) can make the difference between a substantially above normal year/season for precipitation versus one that's substantially below normal. Take 2024 as an example (calendar year in this case) when SAN had 11.16" of precipitation (about an inch above average). While not that far above normal, had SAN not had rain on 22 Jan 2024 (the day where 2.73" fell, mostly in around 6 hours and was associated with severe flooding in parts of the city), we would have had 8.43" that year, or around 15% below normal.
And finally, to show how great year to year variations are in southern Califonria, take a look at another map from Michael Dettinger which shows the coefficient of variation for annual precipitation (same source as above image):
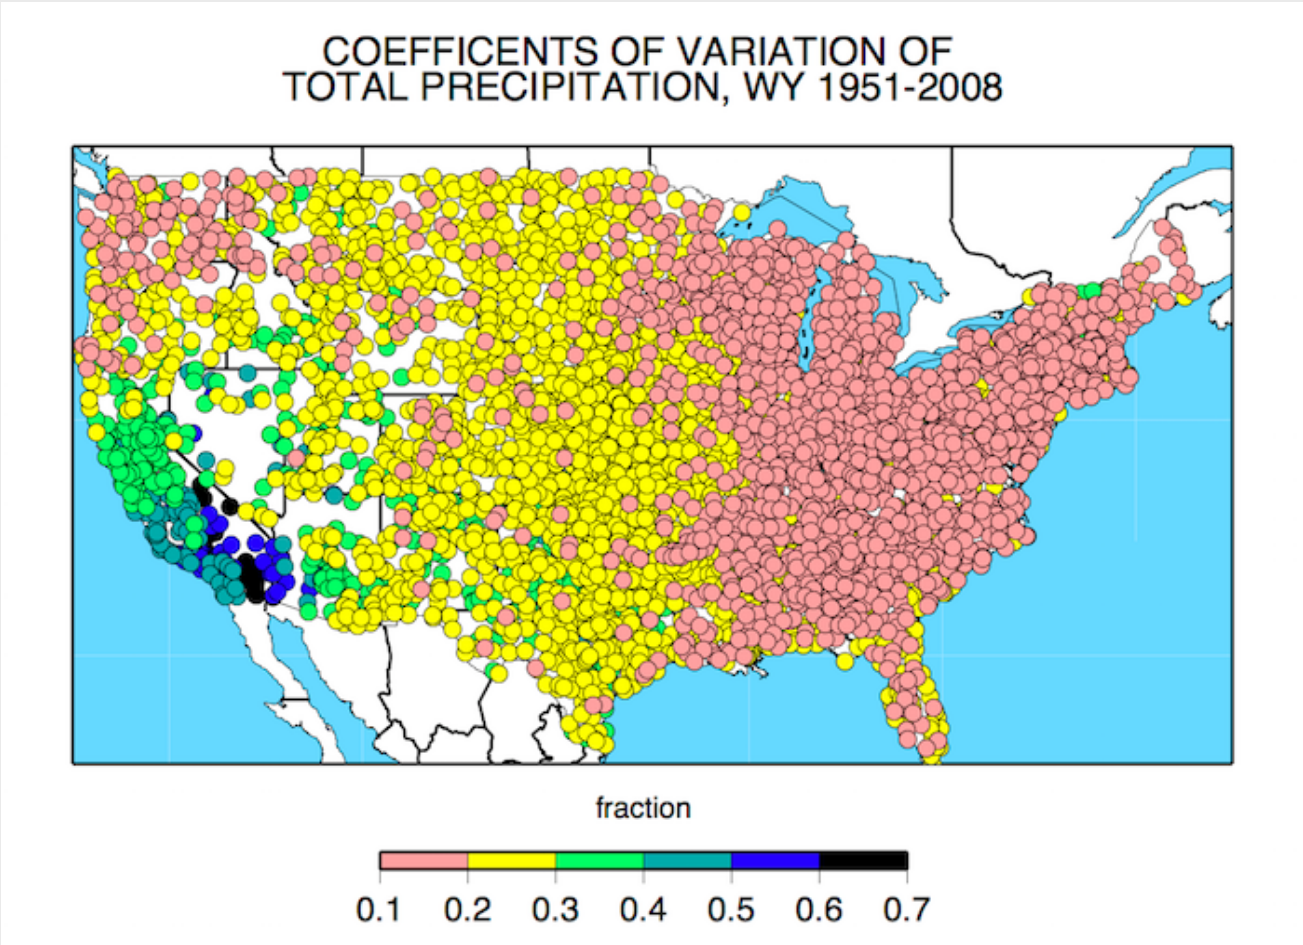
First of all, coefficient of variation is the standard deviation divided by the mean (average). so it is a measure (as the name suggests) of the variability (the higher the value, the more variability; if a variable has a large range relative to its average, it will usually have a high coefficient of variation).
California has, overall, the greatest variability of any state, at least in the "Lower 48" (with Nevada and Arizona close), while the eastern US and parts of the Pacific Northwest have more consistency year-to-year. Generally, dry climates that occasionally have big rains are going to have the greatest year-to-year variability (like the Southwestern US), while wet climates where going two weeks without precipitation is considered "dry" have the least amount of year-to-year variability. For example, San Diego has annual precipitation range from 3.41" (not counting years with some missing data) to 27.59" (so the highest year is about 8 times the lowest), while a place like Buffalo, New York, with much more consistent precipitation has an annual precipitation range from 22.16" to 60.24" (so the highest year is less than 3 times the lowest). If you want, you can go to a more extreme place like Death Valley, California where one year (1929) had no precipitation measured (officially not even a trace), versus 2005 which had 4.73" (so a factor of infinity) or the Atacama Desert in Chile where one location went over 100 years without precipitation being measured. I will plan on discussing this more in a future blog post.
The big picture in southern California is that precipitation is highly variable, even during the "wet" season (which isn't really that wet compared to wet seasons (or even some drier seasons) around the world, and just because you have a dry period during the wet season doesn't mean you're doomed for that season.