Periodic analyses of weather and climate will be posted here, with links to previous editions at the bottom. Remember to click on the image if you need to zoom in.
Sea surface temperatures continue their climb around the world. The ECMWF just issued a statement on how we set the all-time record a week ago for highest near-global average sea surface temperature, beating out the previous record set in 2024: https://climate.copernicus.eu/copernicus-daily-global-sea-surface-temperature-breaks-2024-record. This is an especially good graph that they included in their discussion:
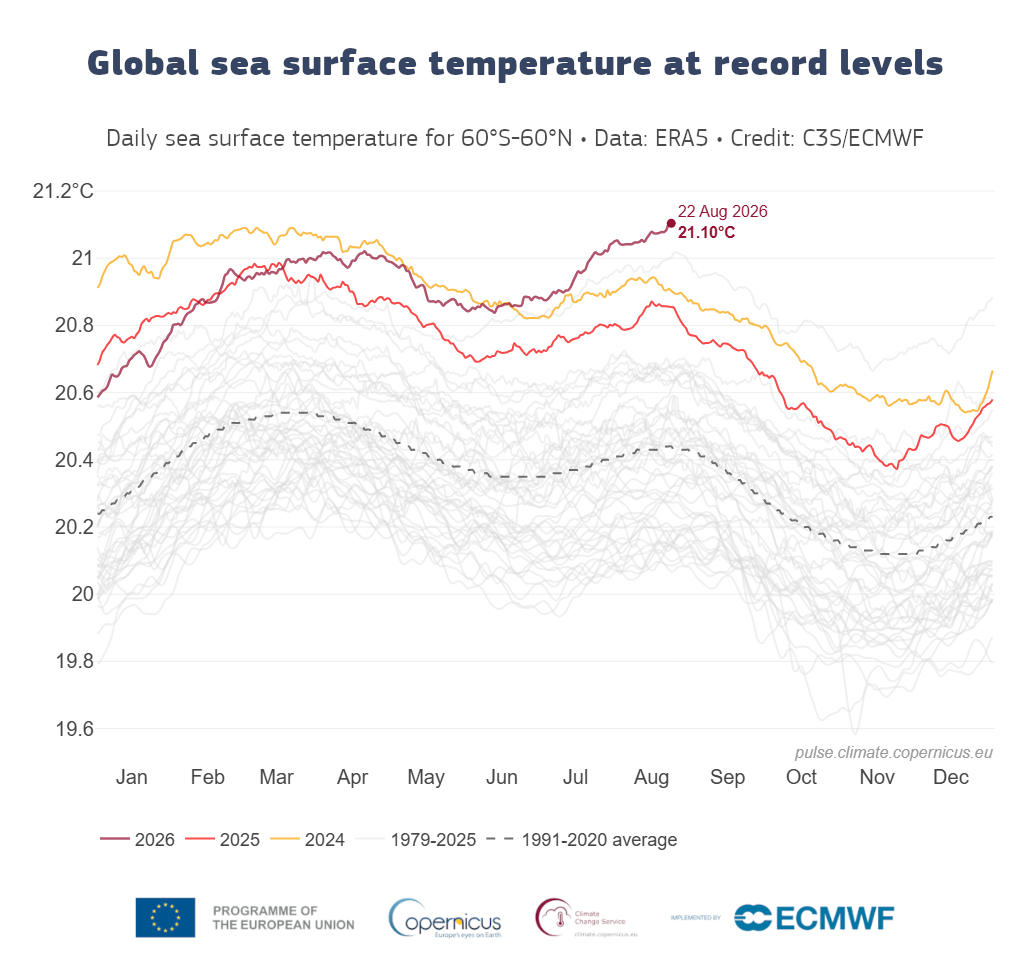
While the El Niño continues to strengthen, that only further increases the global average sea surface temperatures beyond what were already strong positive anomalies in 2024 and 2025 (the last El Niño ended in early 2024, so 2024 and 2025 were associated with the overall long-term water (and air) temperature increases. We will look at a way to view the temperature increases via maps showing the year of the highest monthly average sea surface temperature for July and January between 1982 and 2026 (using this dataset which has 1/4° Latitude/Longitude resolution: https://psl.noaa.gov/data/gridded/data.noaa.oisst.v2.highres.html), and most of the records have come since 2015 (that year happened to be during a marine heat wave in the northeastern Pacific).
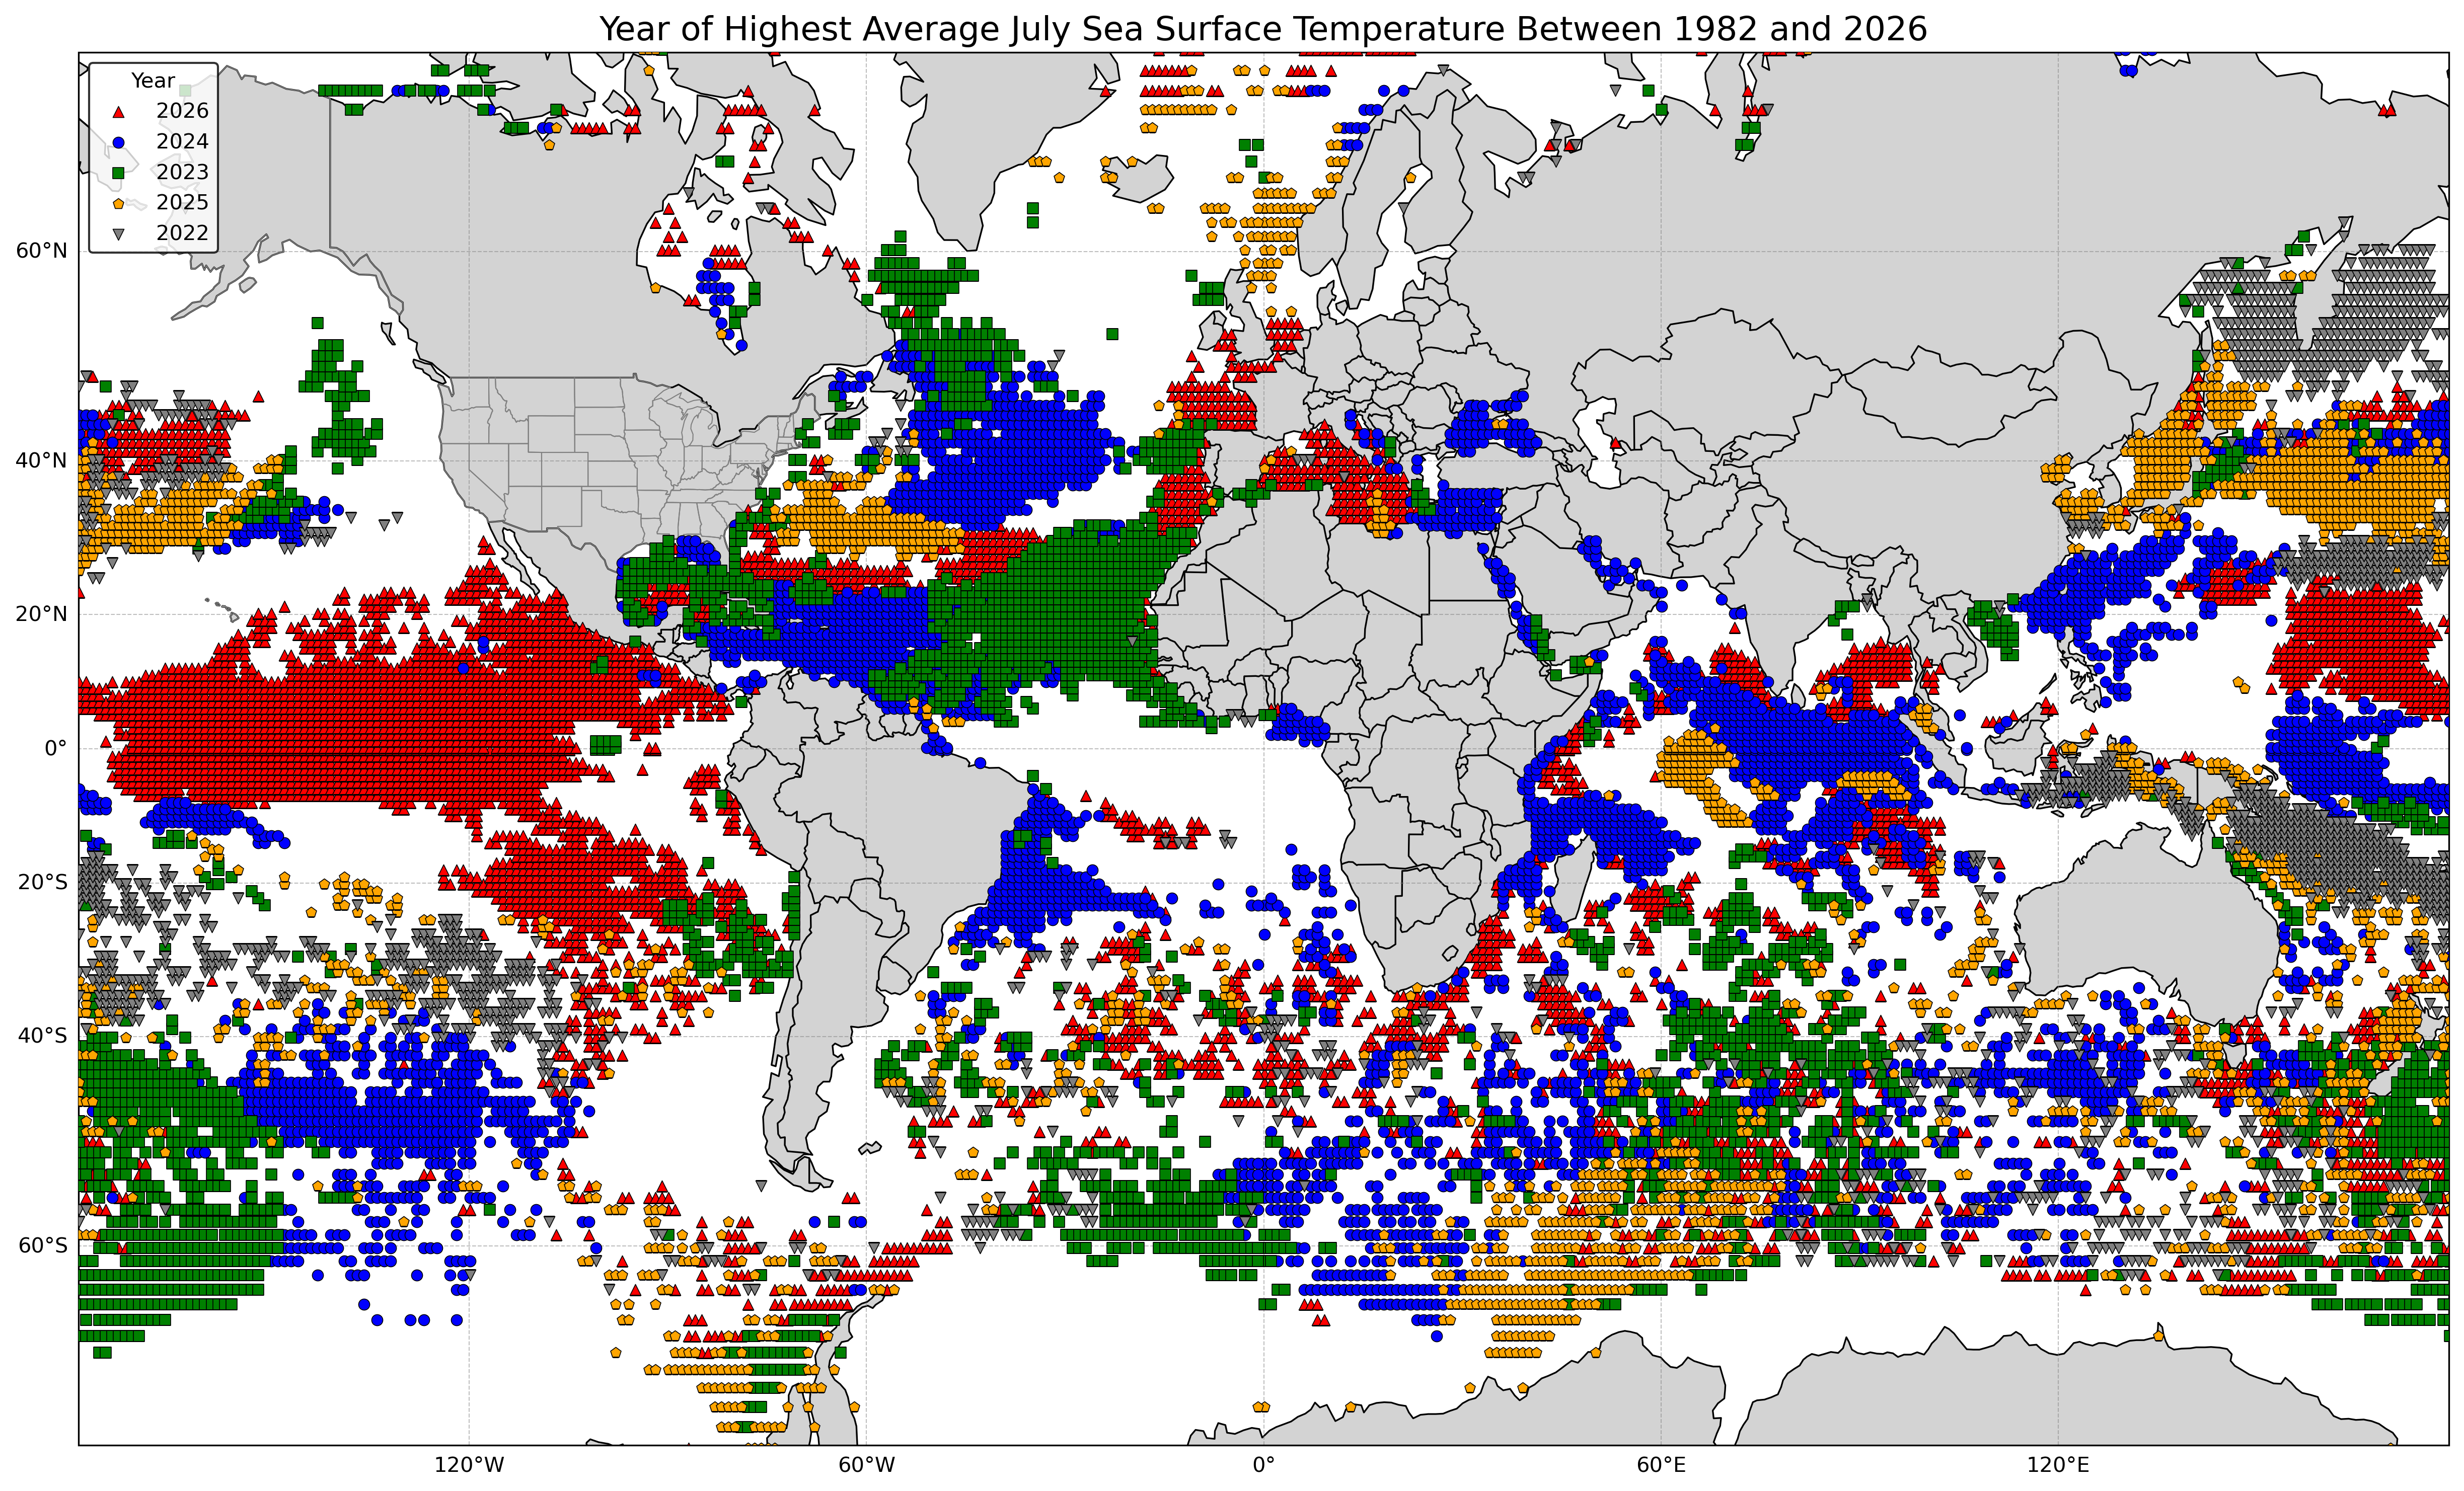
I restricted the data to every degree of latitude and longitude for easier viewing. Regardless, a lot of oceanic areas have had their warmest July between 1982 and 2026 during the past 5 years, 47% to be exact (with 16% in 2026). With El Niño, 2026 has been especially warm in the central and eastern tropical Pacific, with a lot of these areas having the highest July sea surface monthly temperatures, versus in 2023 and 2024, where the records were more in the tropical Atlantic, including the Caribbean. Not surprisingly, with the heat wave in Europe, coastal waters around Europe, including the Mediterranean, had a lot of locations where July 2026 was the warmest. Here are the global annual statistics for records:
Rank       Year      Percentage of All-Time July Record
                       Monthly Sea Surface Temperatures

1.         2026                  15.7
2.         2024                  12.3
3.         2023                   8.2
4.         2025                   6.1
5.         2022                   5.2

All other years since 1982       52.6
Now let's look at January, which has somewhat different signals (though records will likely be set for January in 2027):
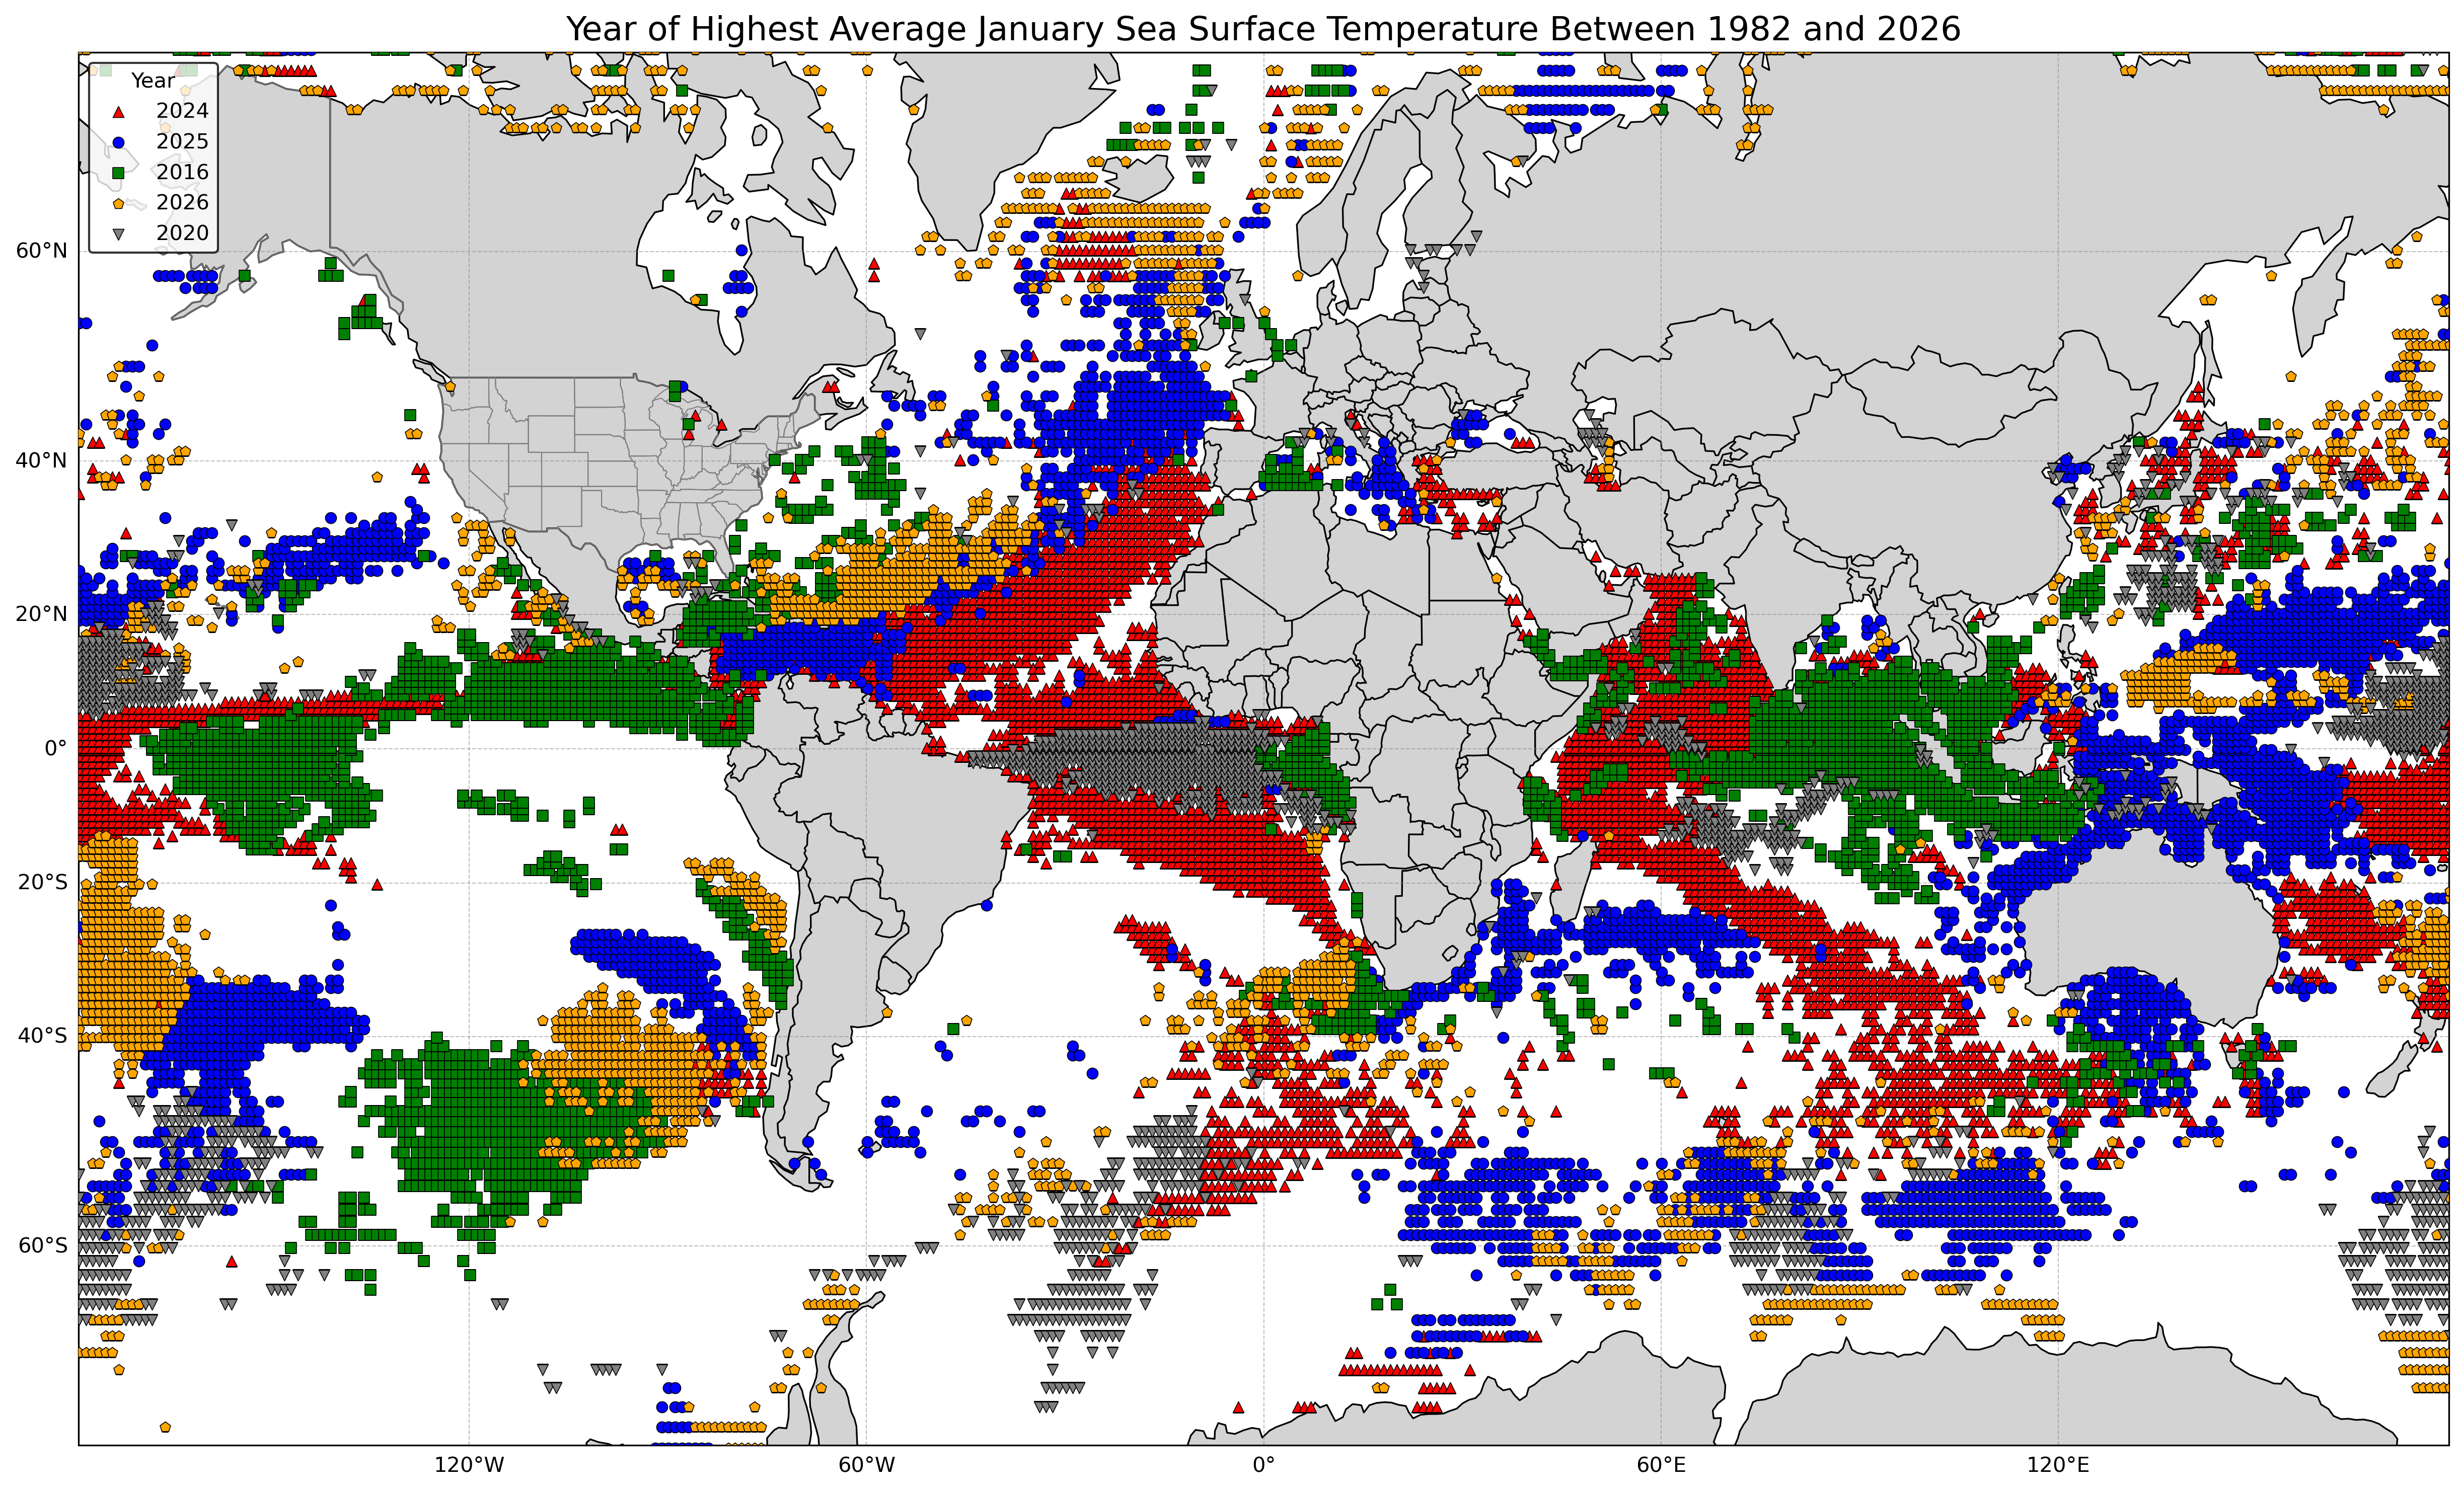
Oddly, January 2016 set a lot of records in tropical areas of the Pacific and Indian Oceans, even though there was not an El Niño at the time. However, looking at only the top 5 ignores the smaller areas that define the El Niño, especially the ENSO 3.4 region, defined along a narrow equatorial strip between 170°W and 120°W and 5°N and 5°S. Regardless, the top 5 years for January record high monthly sea surface temperature (all since 2016) accounted for 46% of the total.
Rank       Year     Percentage of All-Time January Record
                       Monthly Sea Surface Temperatures

1.         2024                  14.0
2.         2025                  10.8
3.         2016                  10.0
4.         2026                   6.4
5.         2020                   5.1

All other years since 1982       53.6
We can specifically look at the tropical eastern and the northeastern Pacific (areas bounded by 10°S and 60°N and 180°W and 70°W, so that includes a few nearby non-Pacific waters) to note the years of importance here (including in the ENSO 3.4 region).
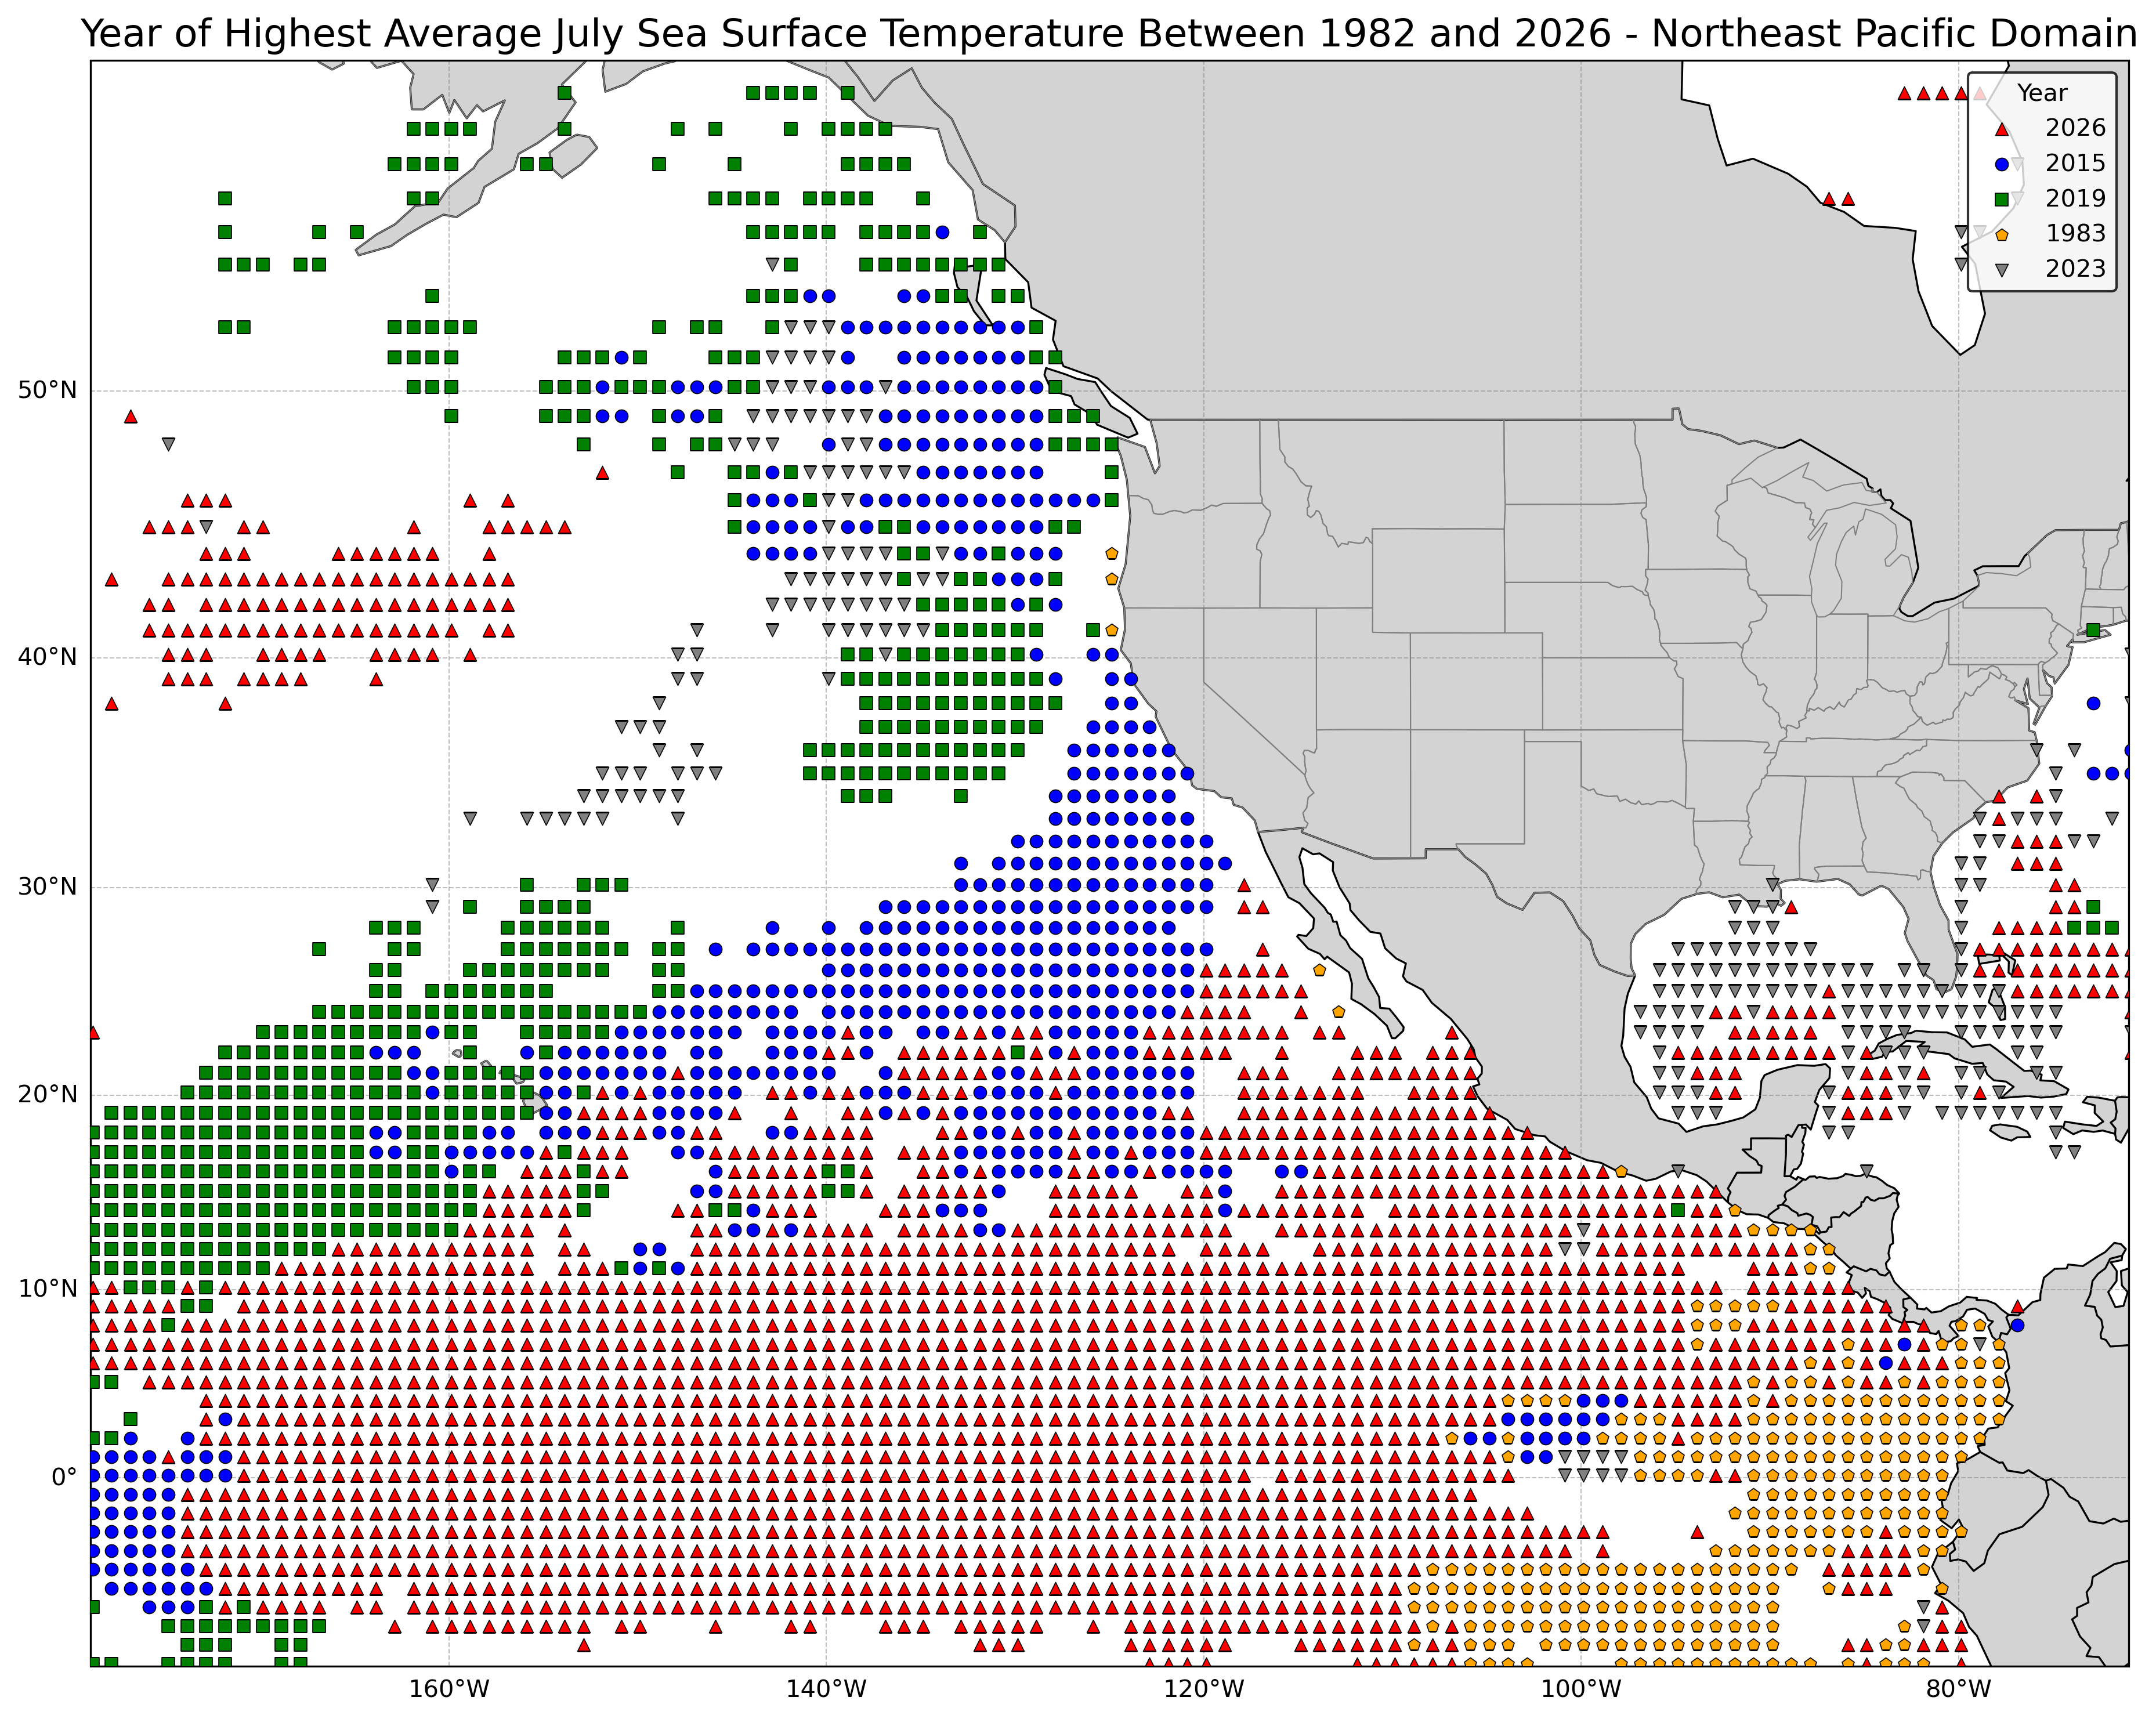
2026 clearly dominated the tropical East Pacific for warmest water for July, but the 2015 marine heat wave was substantial in the northeastern Pacific. Despite the El Niño having ended during summer 1983, some extremely warm water lingered in the far eastern tropical Pacific. Note that 2023 was extremely warm (hot) in the Gulf of Mexico, when the sea surface temperature in shallow water in Manatee Bay reached 38 C/101 F, and not surprisingly, the Atlantic hurricane season was quite active. Next, January in the east tropical and northeast Pacific:
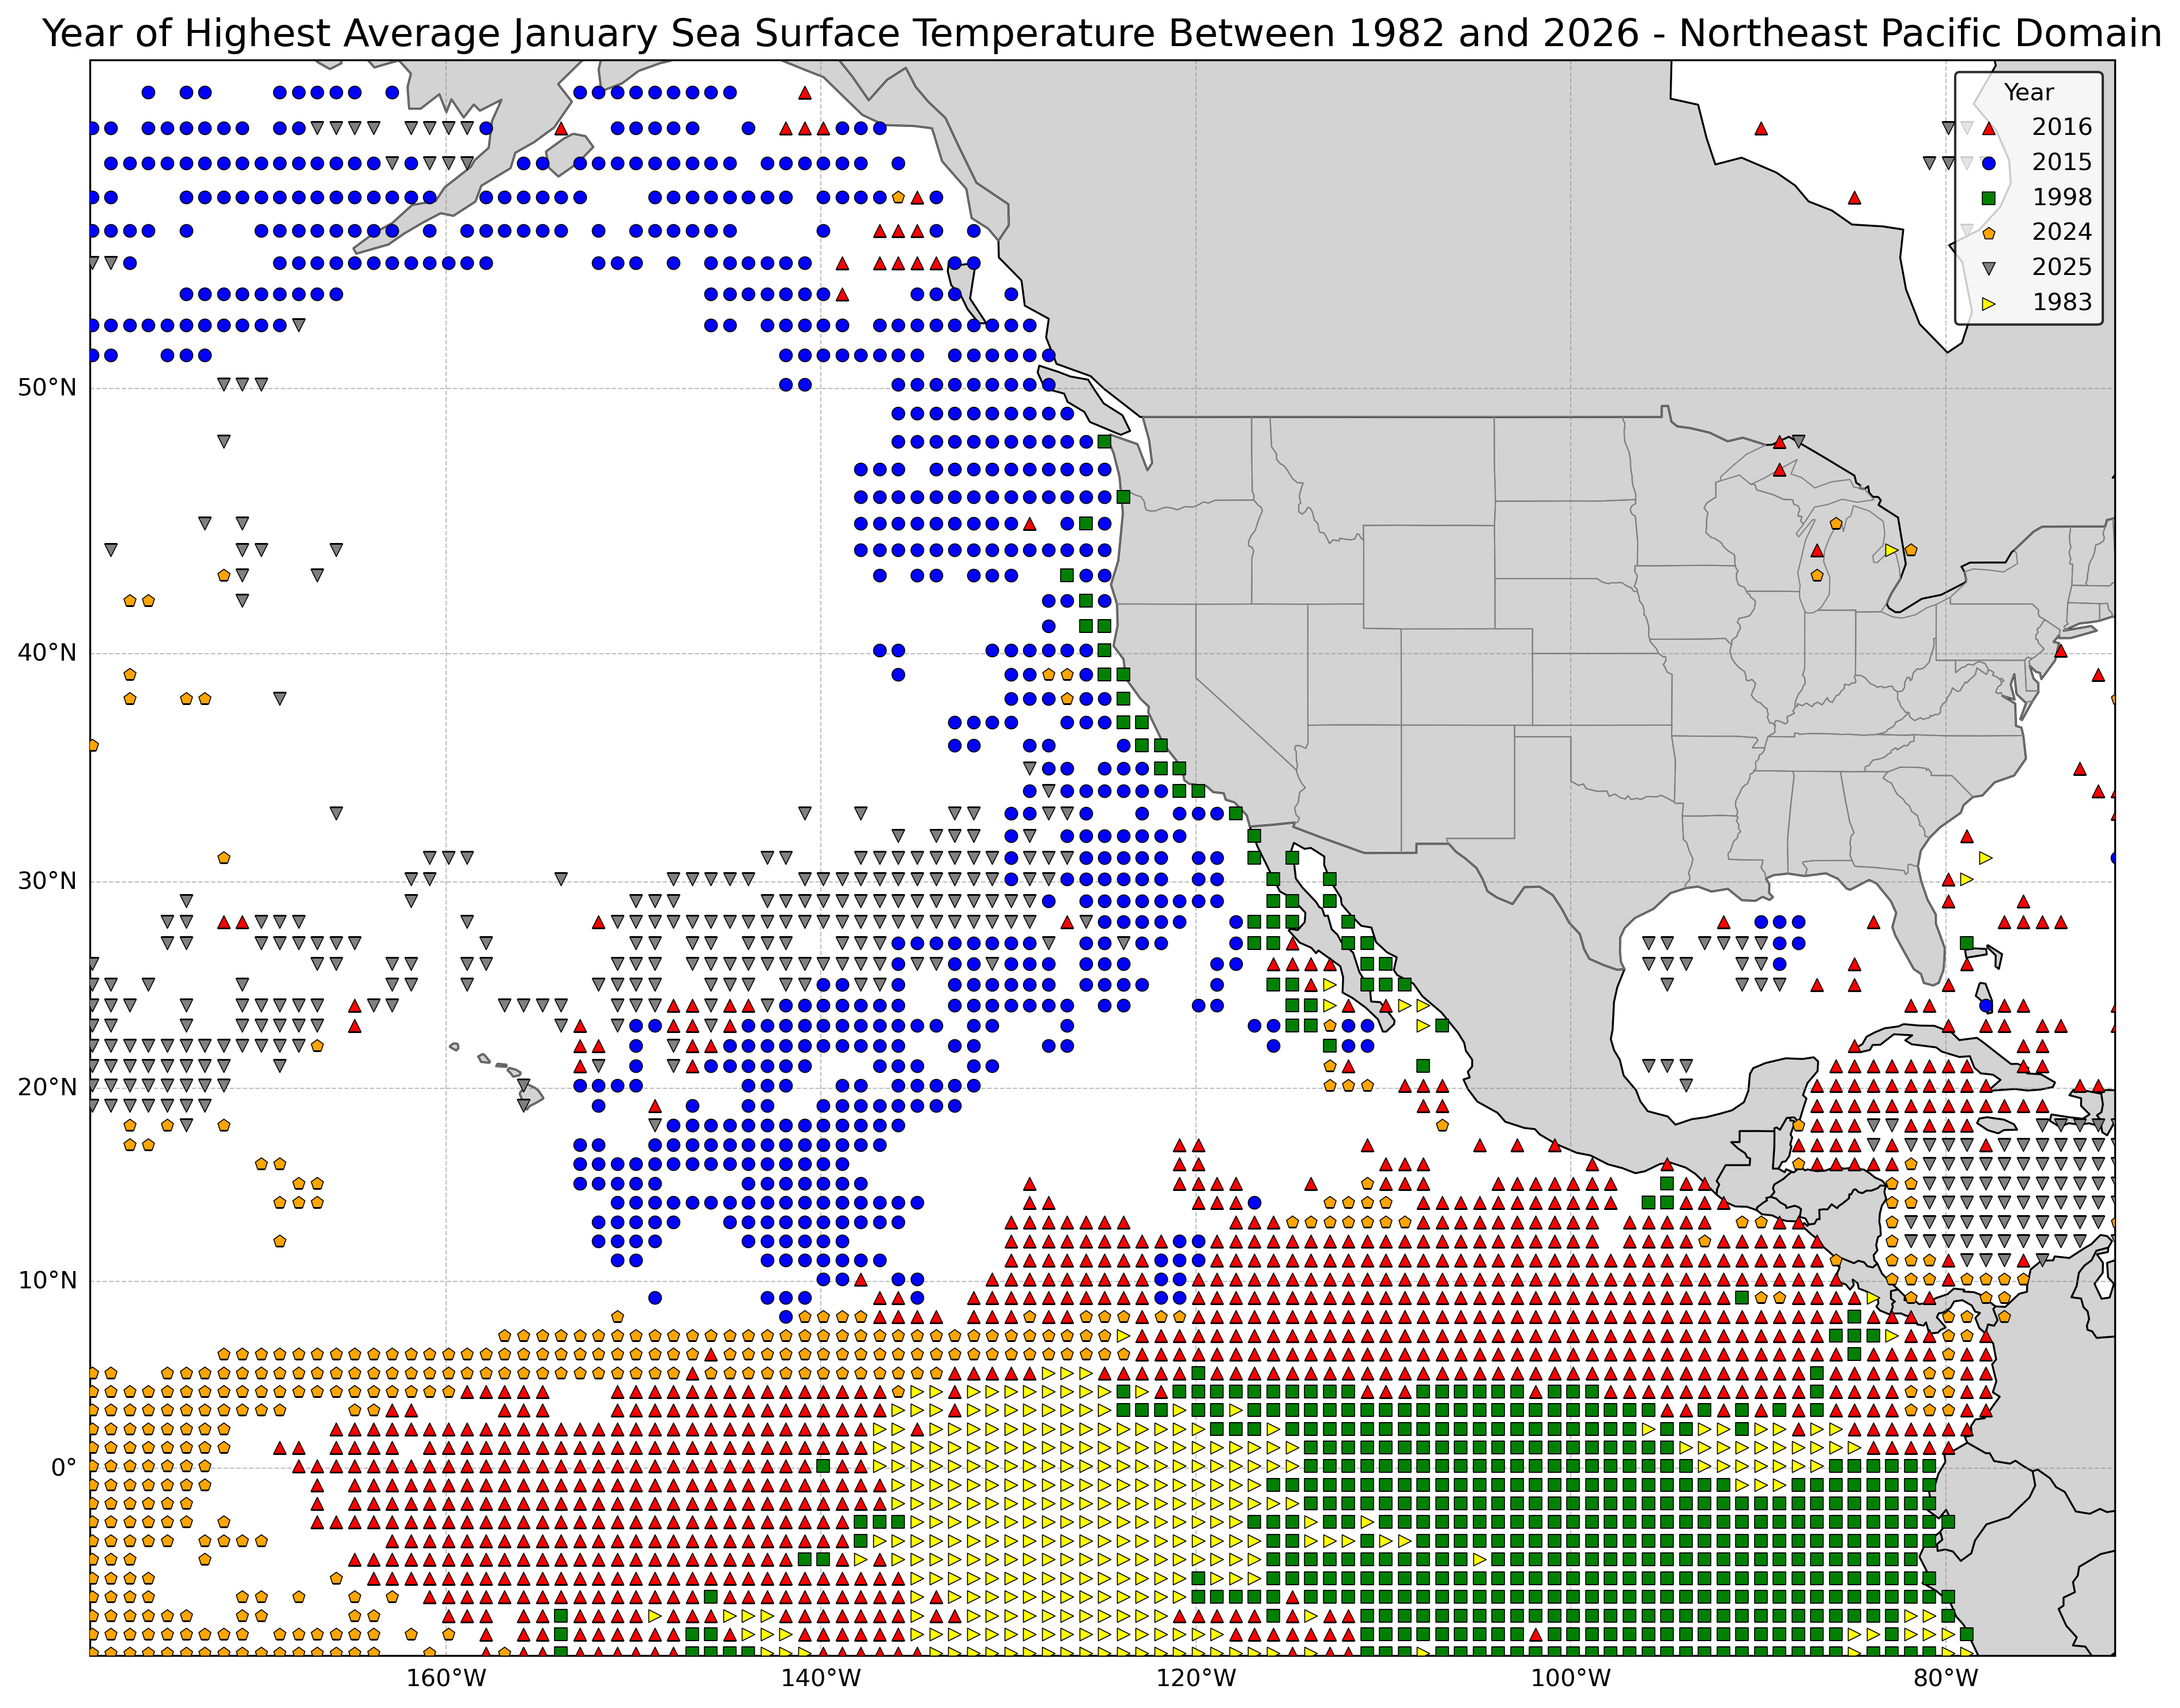
The past El Niño years of 1983 and 1998 show up in the tropical East Pacific, though since the record warm water showed up over a relatively small area, they were only #6 and #3, respectively, for the areal coverage of January monthly highest averages. The rest of the years were all since 2015. Note that one can (again) see the northeastern Pacific marine heat wave in the above map for 2015, and many tropical areas were anomalously warm in 2016. And for the grand finale of this sort of map, let's look at the year where the highest monthly average sea surface temperature occurred, regardless of month:
Note I included 2026, even though that was #6, though this only goes through July, so it will almost certainly rising in the ranking when the August stats are finalized. And now the associated stats:
Rank       Year     Percentage of All-Time Record Monthly
                     Sea Surface Temperatures for Any Month

1.         2024                  16.3
2.         2023                   8.6
3.         2025                   7.7
4.         2016                   6.6
5.         2015                   5.6
6.         2026                   5.2 - only through July

All other years since 1982       50.0 (44.8 without 2026)
We can look more locally at sea surface temperatures and how anomalously high they are this year by viewing data for various buoys along the San Diego (and other parts of the California) coast. For instance, here is the Torrey Pines Outer Buoy, located approximately 13 km/8 miles off the coast from Torrey Pines State Reserve.
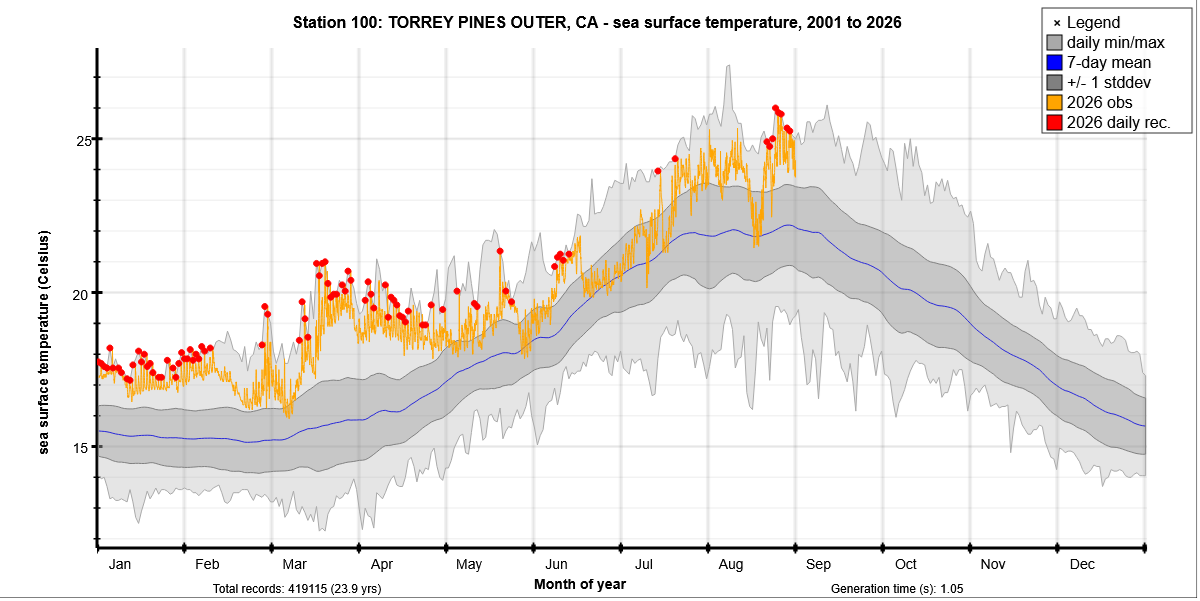
There were a lot of record daily highs set this year (2001 to 2026 is the extent of this database, and a complete database dashboard can be found here on this Scripps Institution of Oceanography website at https://cdip.ucsd.edu/m/products/climatology/, which is where the above image is from). However, the all-time record has not been set this year (through 31 Aug); instead that was set on the afternoon of 8 Aug 2018 with a sea surface temperature of 27 C/81 F, definitely more like Hawaii than California. Note that even very warm years like 2026 can have brief dips in the water temperature, even a bit below the long-term average, due to upwelling of colder water beneath, associated predominantly with a more northerly component of the surface wind along the West Coast of the US, especially when winds are stronger.
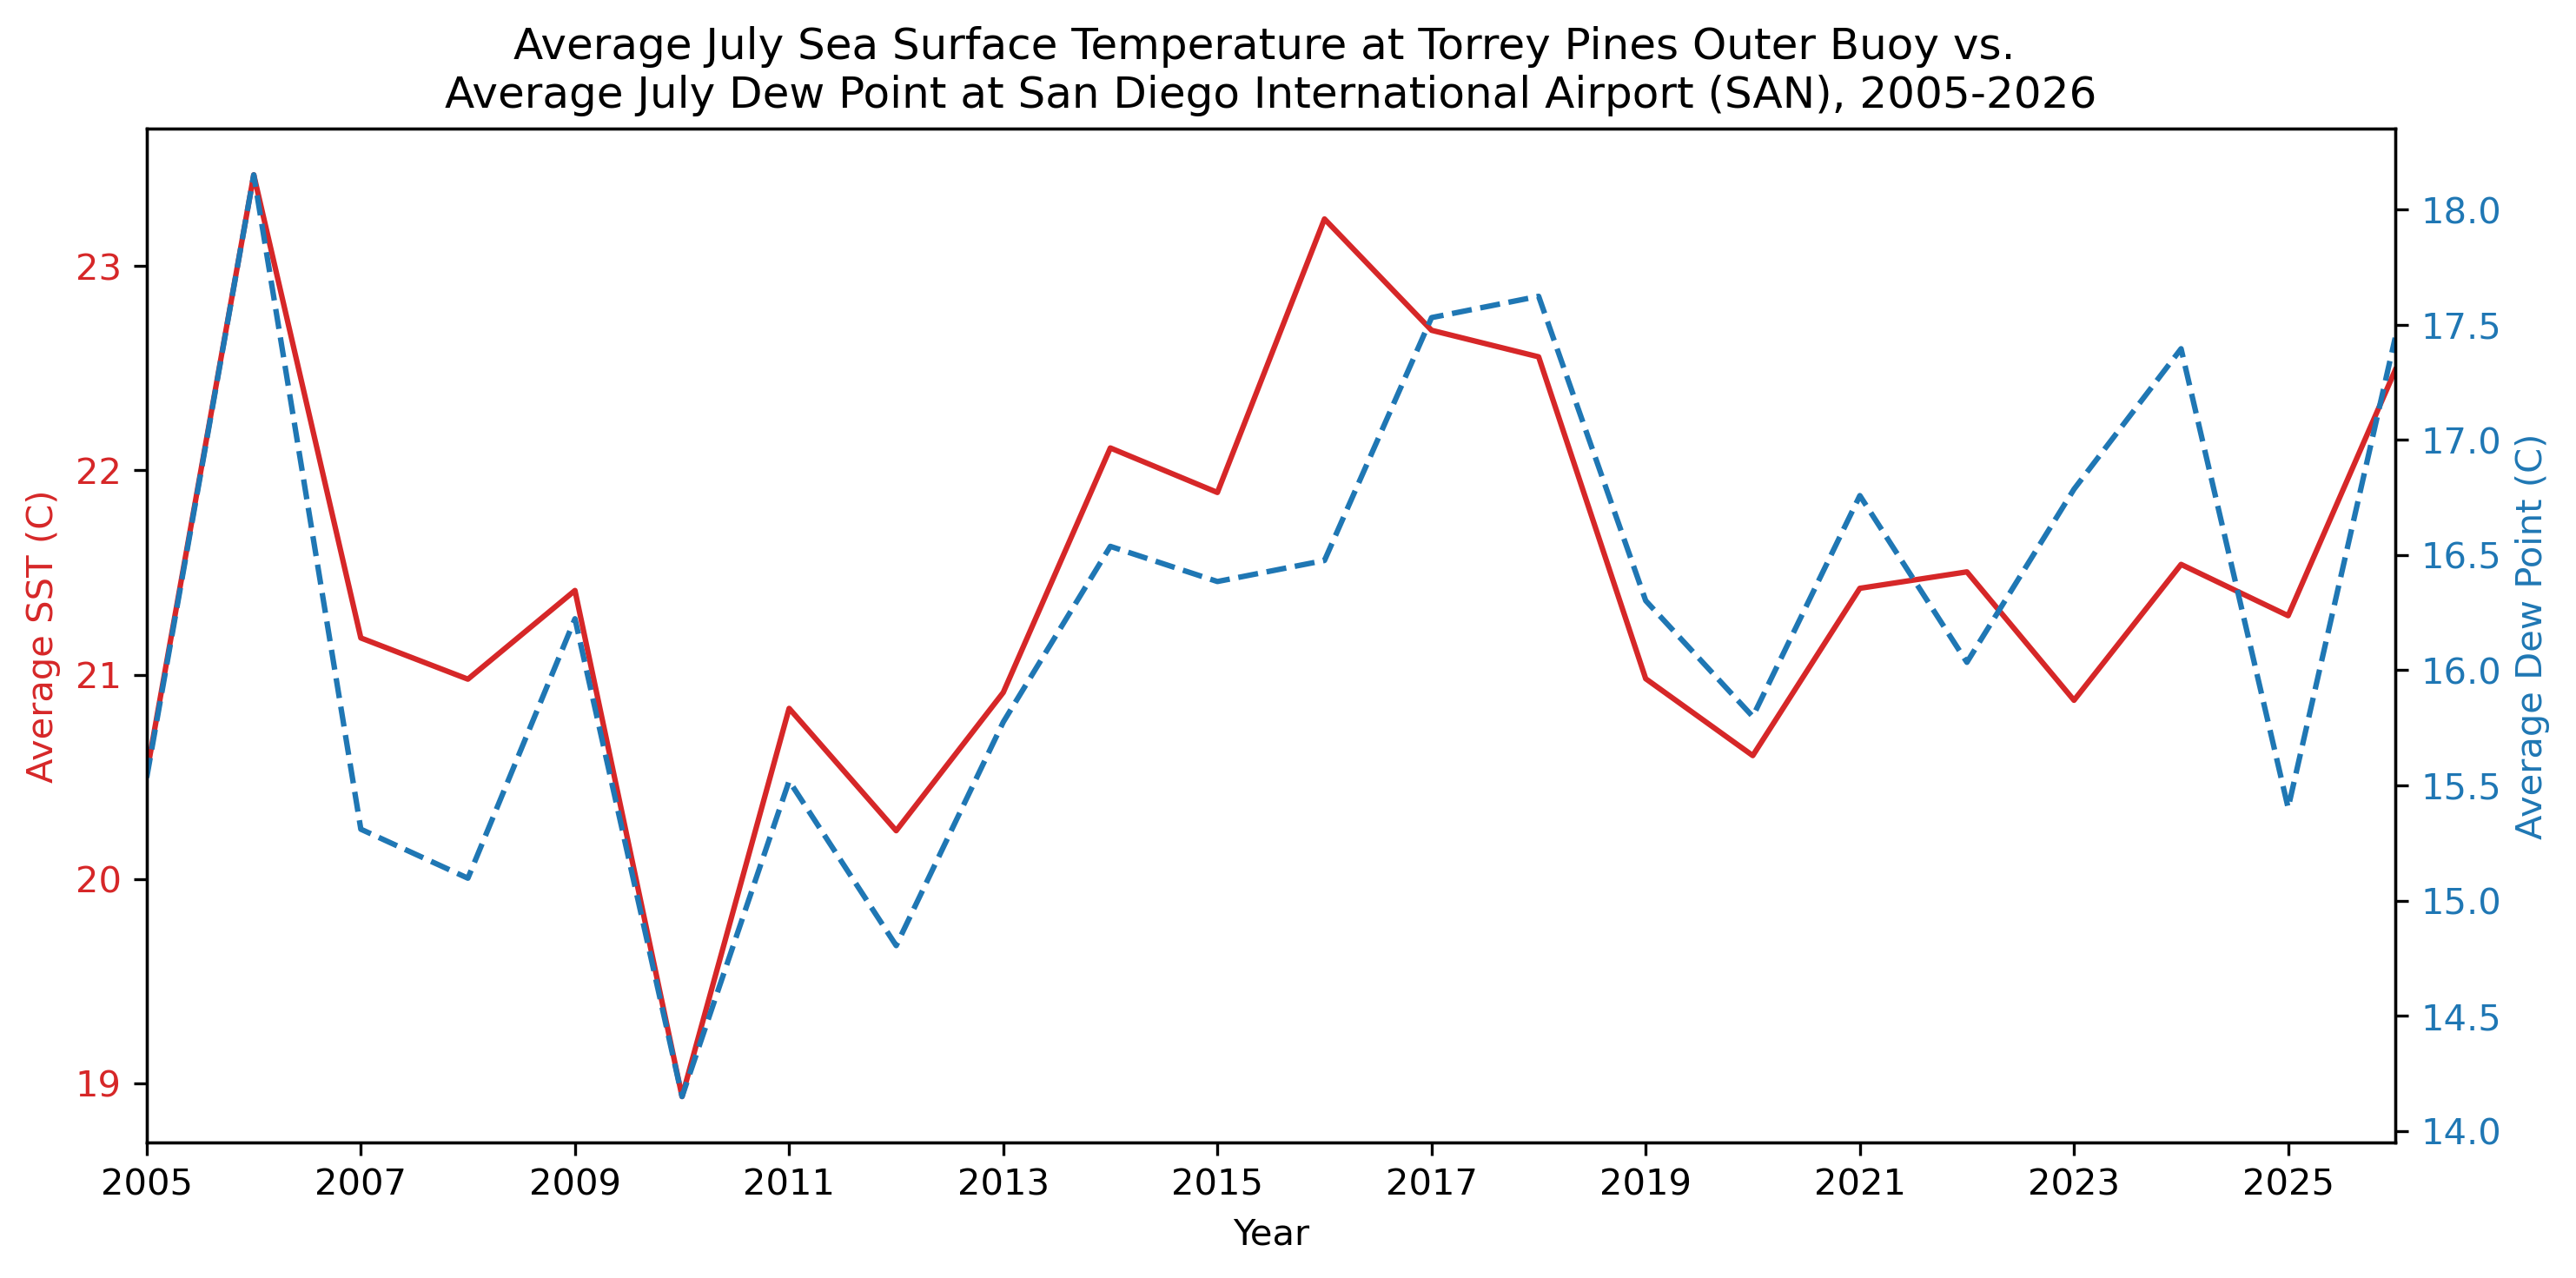
The largest impact of the sea surface temperatuers along the San Diego coastline is not precipitation (water temperatures along the equator of the East Pacific are the biggest factor there for winter precipitation) but instead local humidity. The correlation coefficient between the monthly average sea surface temperature in July at the Torrey Pines Outer Buoy and the average dew point in July at San Diego International Airport (SAN) was an astonishing 0.83 between 2005 and 2026 (using the data set from the National Buoy Data Center). This would mean that the average July sea surface temperature would explain 69% of the variability in the average July dew point, year to year. This doesn't prove causation (though warmer water is more likely to evaporate into the atmosphere than colder water, given all else being equal), but higher dew points at the coast, often associated with warmer weather, could explain a part of the sea surface temperature variability, though it's widely recognized that upwelling of colder water due to a more northerly component in the coastal winds is a big factor when water temperatures are lower around San Diego. One can see a very close alignment between the two variables here showing that when the sea surface temperatures are higher in the San Diego coastal waters, the dew point (dashed line below) at San Diego is also higher, at least in July (temperatures are in Celsius; for quick reference 20°C=68°F):
Other months have lower correlations betweeh these two variables, even during the other summer months, such as June at 0.62 and August at 0.73 (still quite high), as July is the best month due to prevalent onshore flow (westerly winds off the ocean) and a marine inversion which traps moisture from the ocean below (generally) 1000-2500 feet/300-800 meters. Other moisture can move in aloft, especially when with the North American/Southwest monsoon occurs (the deserts of southeastern California can get quite humid then at the surface dew to Gulf of California moisture), but warmer than normal local Pacific water is a bigger driving force. However, even in January, the correlation is 0.50 between the average monthly Torrey Pines Outer Buoy sea surface temperature and the SAN average monthly dew point.
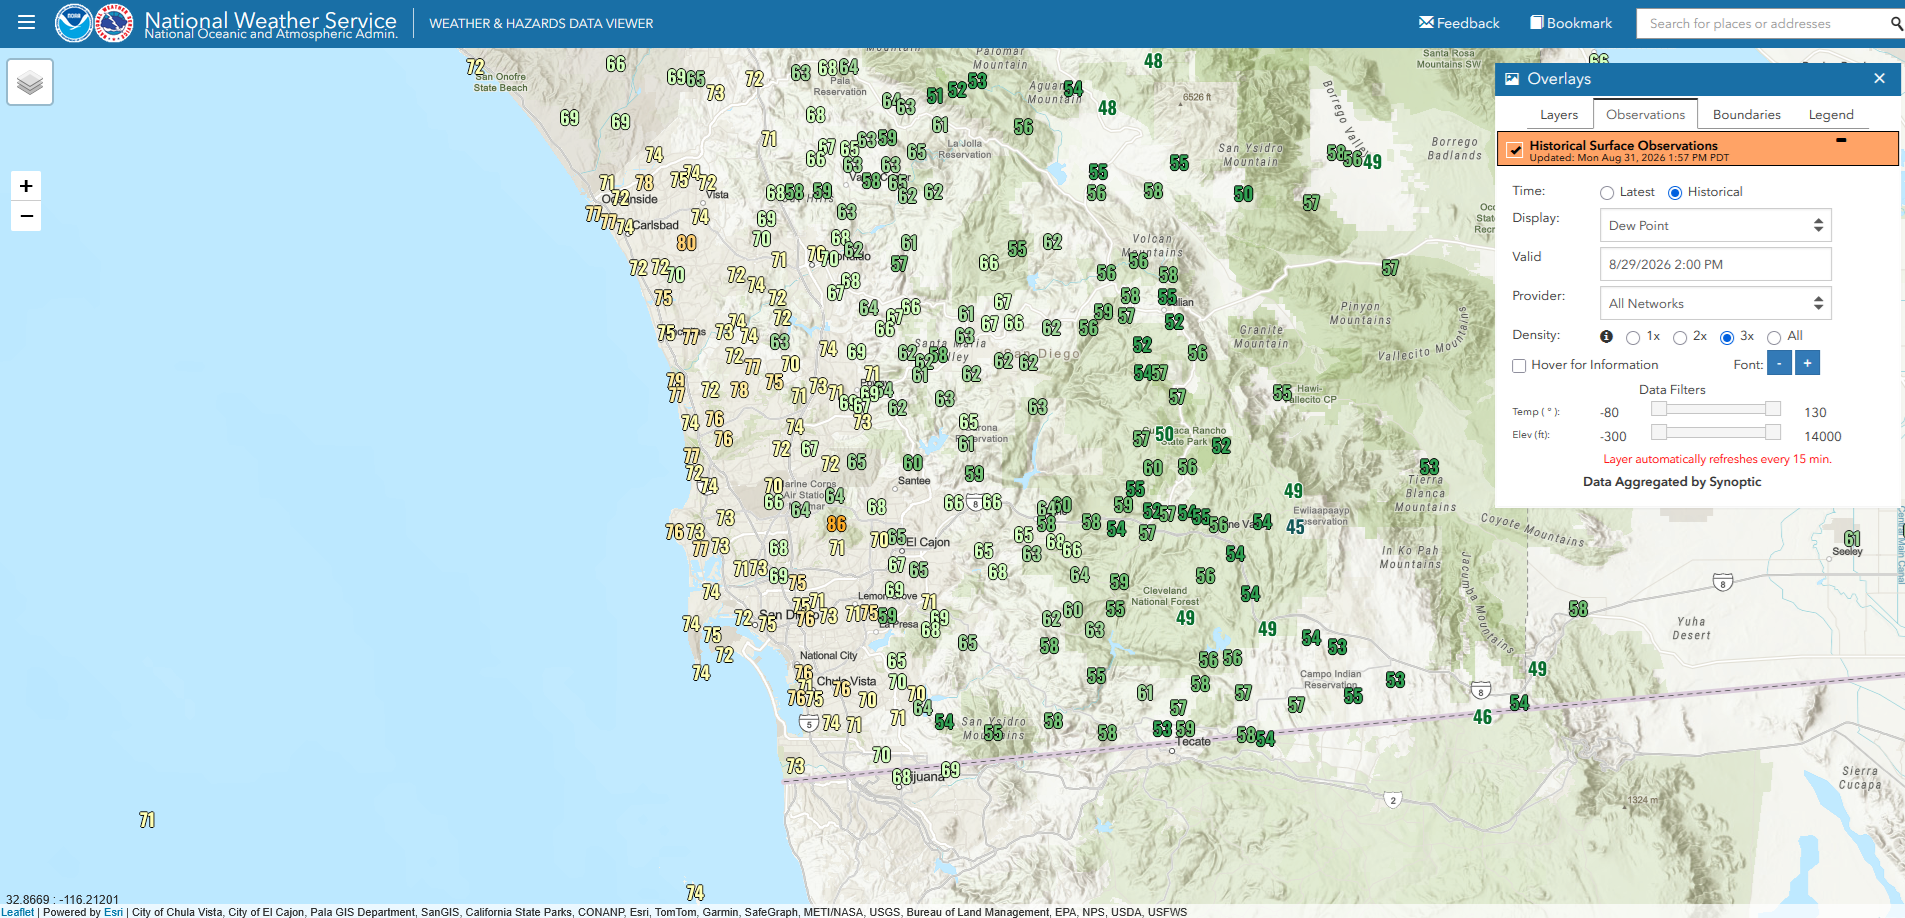
Of course, anyone who has been in San Diego in August 2026 knows that the humidity has been quite high, and in the second half of the month, there were numerous times when the dew point was above 70F/21C at SAN (with a peak of 73F/23C several times), with some local (non-airport) mesonet stations having dew points even exceeding 75F/24C near the coast. Here's an example of dew points around San Diego from 29 Aug 2026 at 200 PM PDT (2100 GMT); not surprisingly, they are highest at the coast and lower inland (the Southwest monsoon had mostly shifted east, so dew points were actually pretty low over the mountains and deserts):
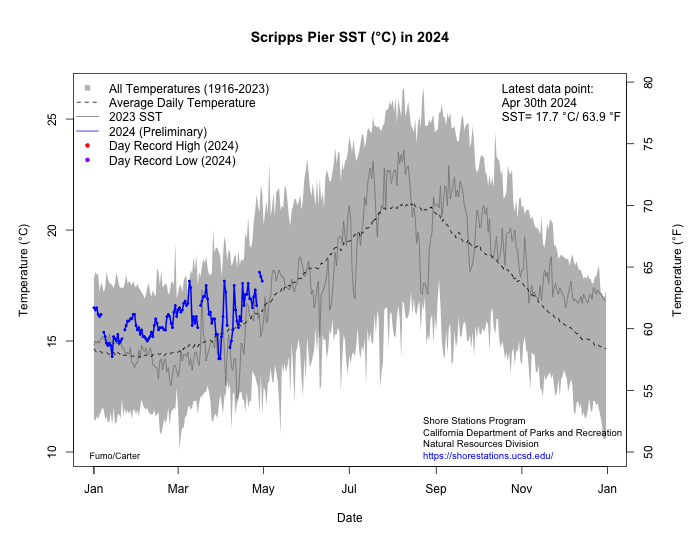
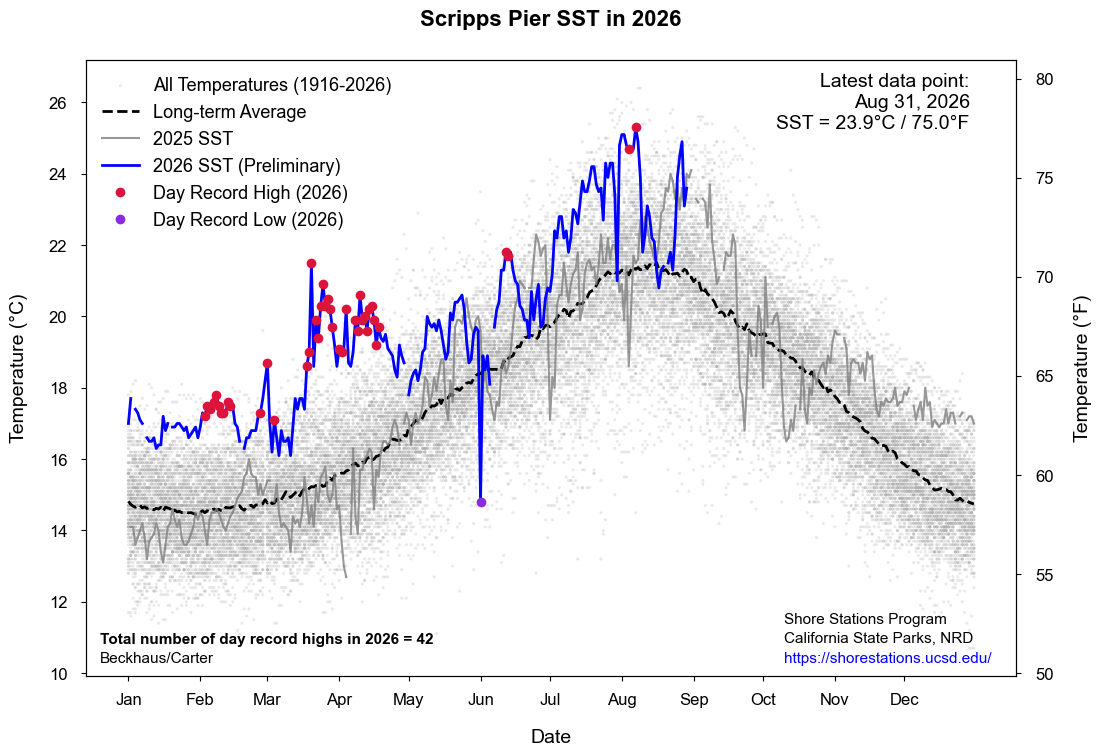
On a personal note, I can almost tell how warm the water at the beach without any research and without actually touching the water based on how muggy it feels (if it's muggy, the warm is probably warm, but on that day at the beginning of June 2026 when the water temperature fell, I was at a meeting at Scripps Institution of Oceanography at the beach, and some of us were outside during a break noting how cold (with wind!) the air felt, definitely more than on adjacent days (and as an additional note, sea surface temperatures are quite closely tied with air temperatures over many oceanic areas)! Look below for the Scripps Pier manual sea surface temperature measurement graph (which goes back over 100 years; this is a very popular graphic which has been referenced by many recently, https://shorestations.ucsd.edu/plots/SST_This_Year.png):
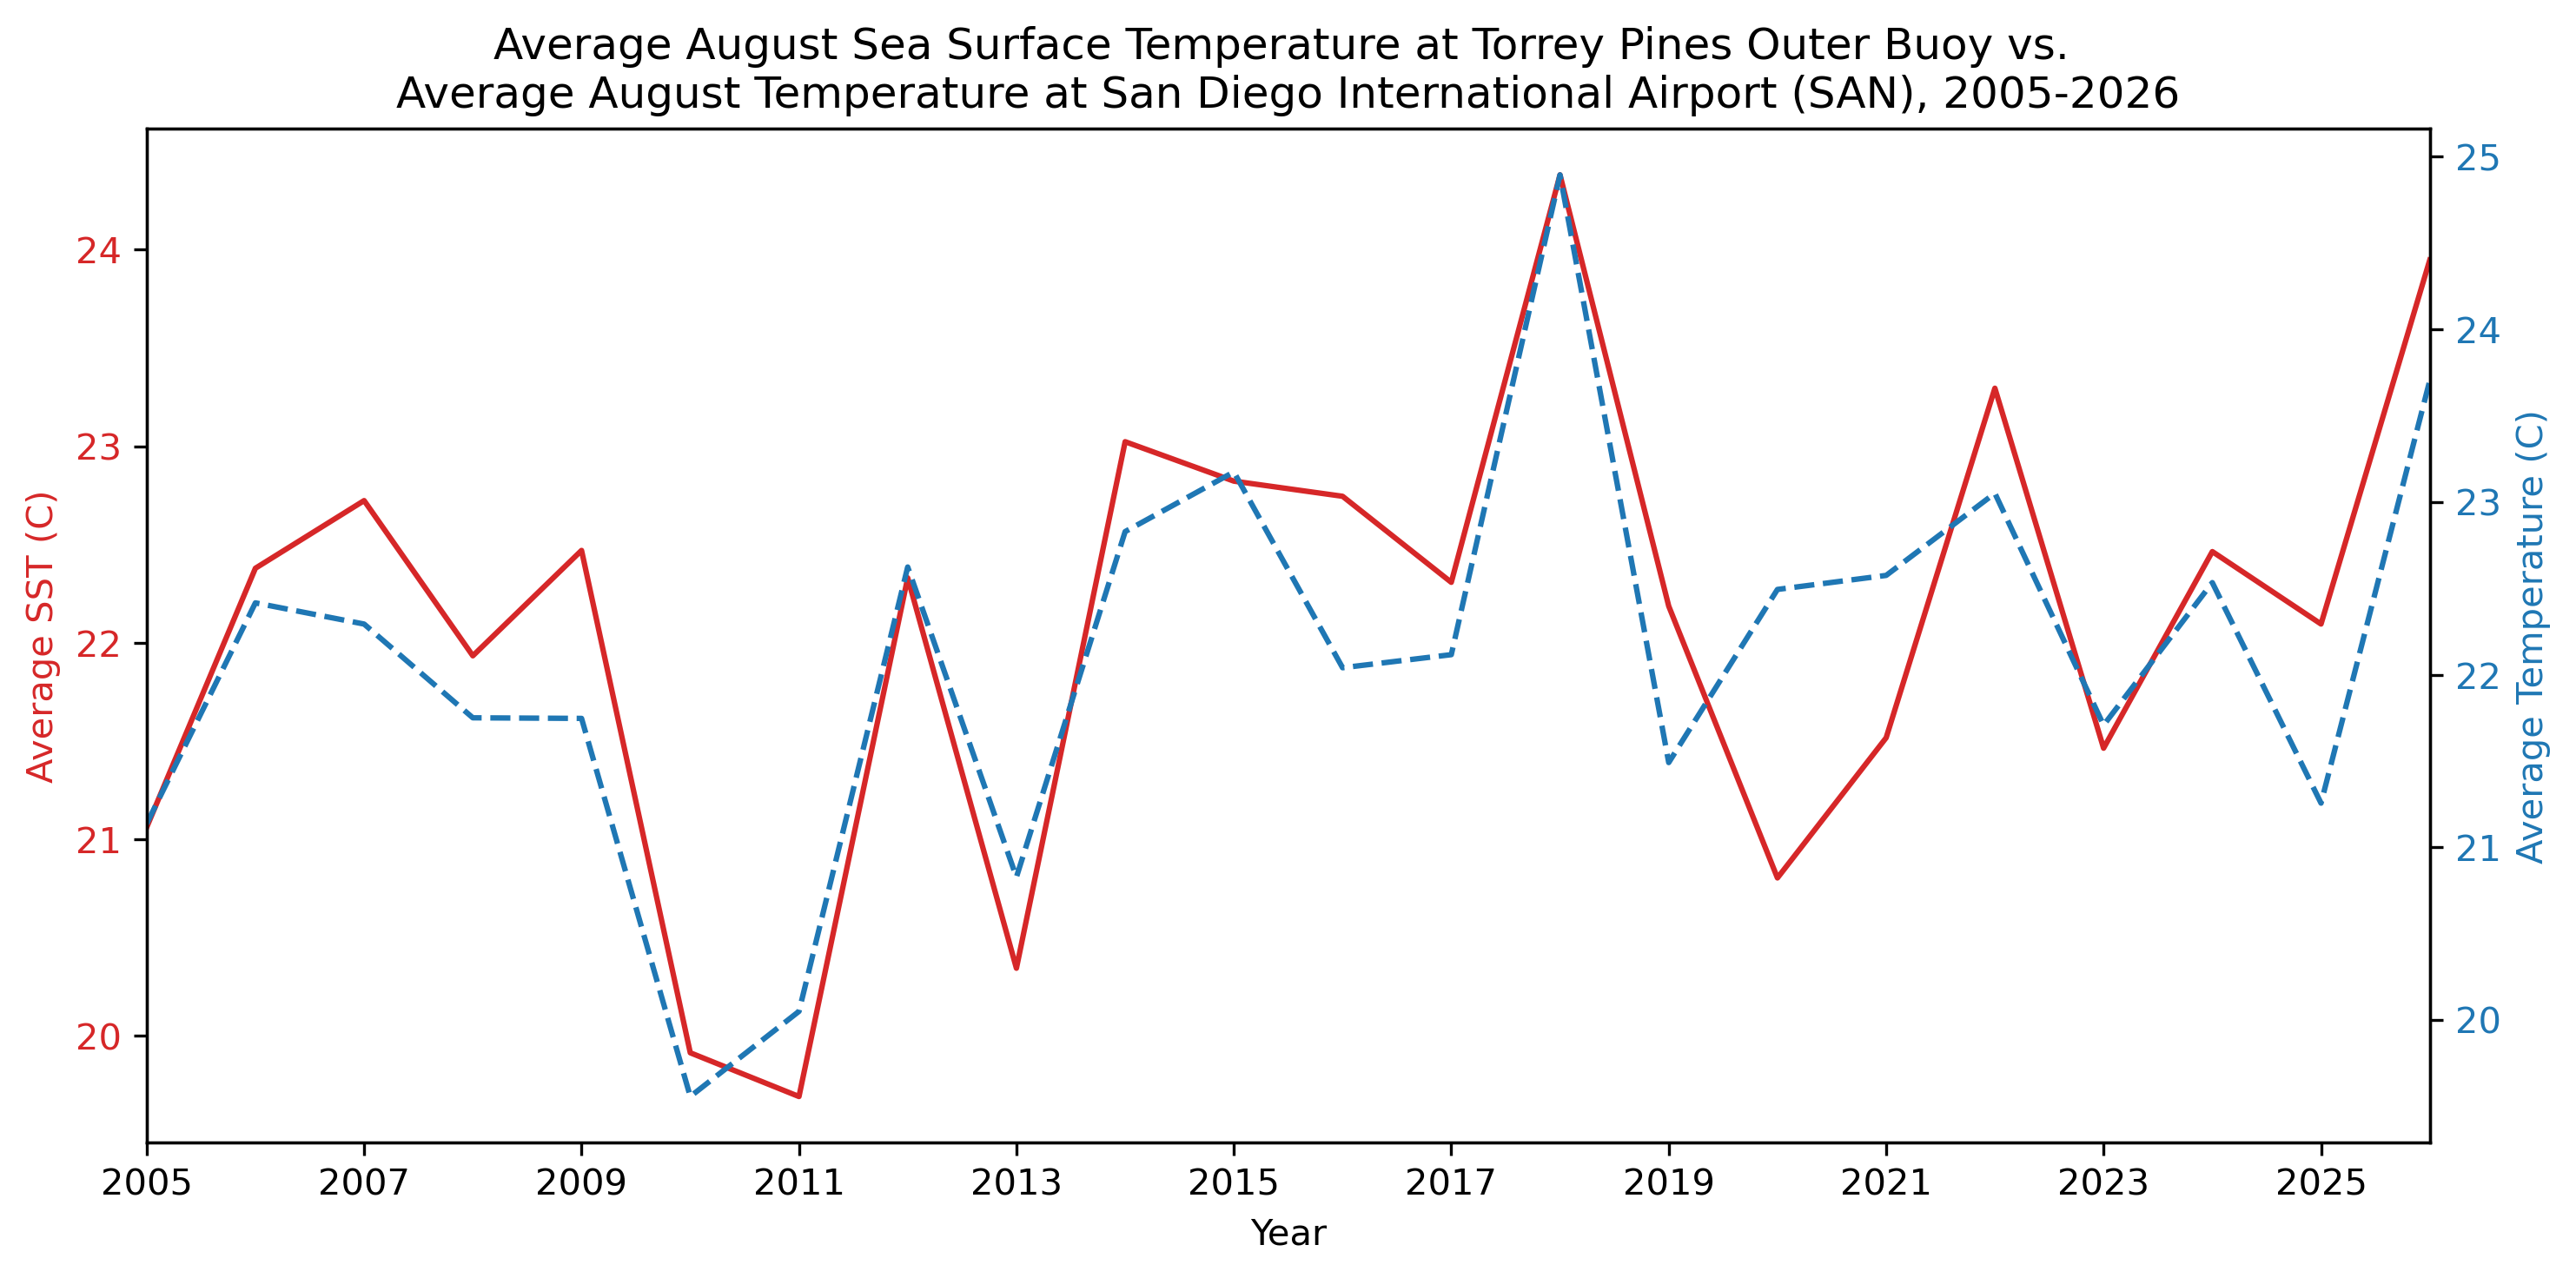
And what about the relationship between sea surface temperature and air temperature? It's strong. August has the best correlation coefficient between the average monthly sea surface temperature at Torrey Pines Outer Buoy and the average monthly temperature for that month at 0.87. July, September, and October are right behind August with correlation coefficients of 0.83, 0.85, and 0.86, respectively. Even in January, the correlation is 0.56. Correlations are even stronger than with dew point, though I think there the causation is on both side, with warmer air keep the adjacent air warmer, but also sunny warm days will warm that top layer of water, especially when upwelling of cold water is curtailed. Here is the close relationship between August sea surface temperatures at Torrey Pines Outer Buoy and the August air temperature (blue, dashed) at SAN:
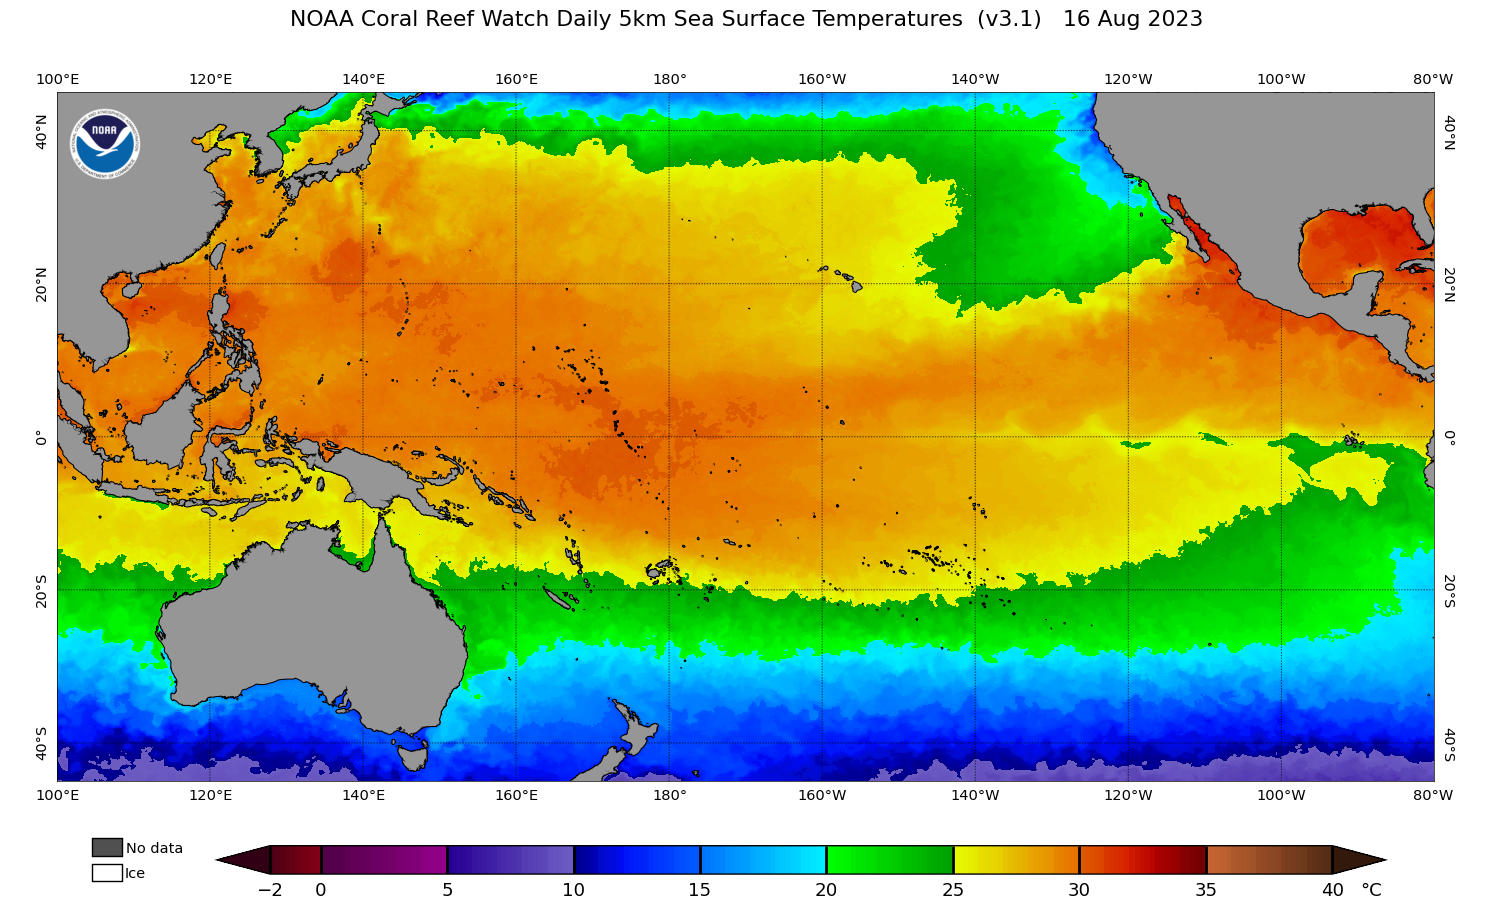
A question that frequently comes up for San Diego is "with all this warm water, could a hurricane land on our doorstep?" There was a (Category 1) hurricane that reached San Diego in 1858 (the center stayed just off the coast though), based on historical accounts of damage (go to https://journals.ametsoc.org/view/journals/bams/85/11/bams-85-11-1689.xml?tab_body=pdf to see the journal article about this: "The San Diego Hurricane of 2 October 1858" by Michael Chenowith and Christopher Landsea, Bulletin of the American Meteorological Society). So, it has happened before, and it's certainly possible in the future. Hurricanes need water of at least 26.5 C/80 F in order to develop or sustain itself, though a hurricane with sufficient strength and speed can move over hundreds of kilometers of water before weakening to below hurricane strength. Here are the recent water temperatures along the Baja California Pacific coast (and Gulf of California), via NOAA/NESDIS:
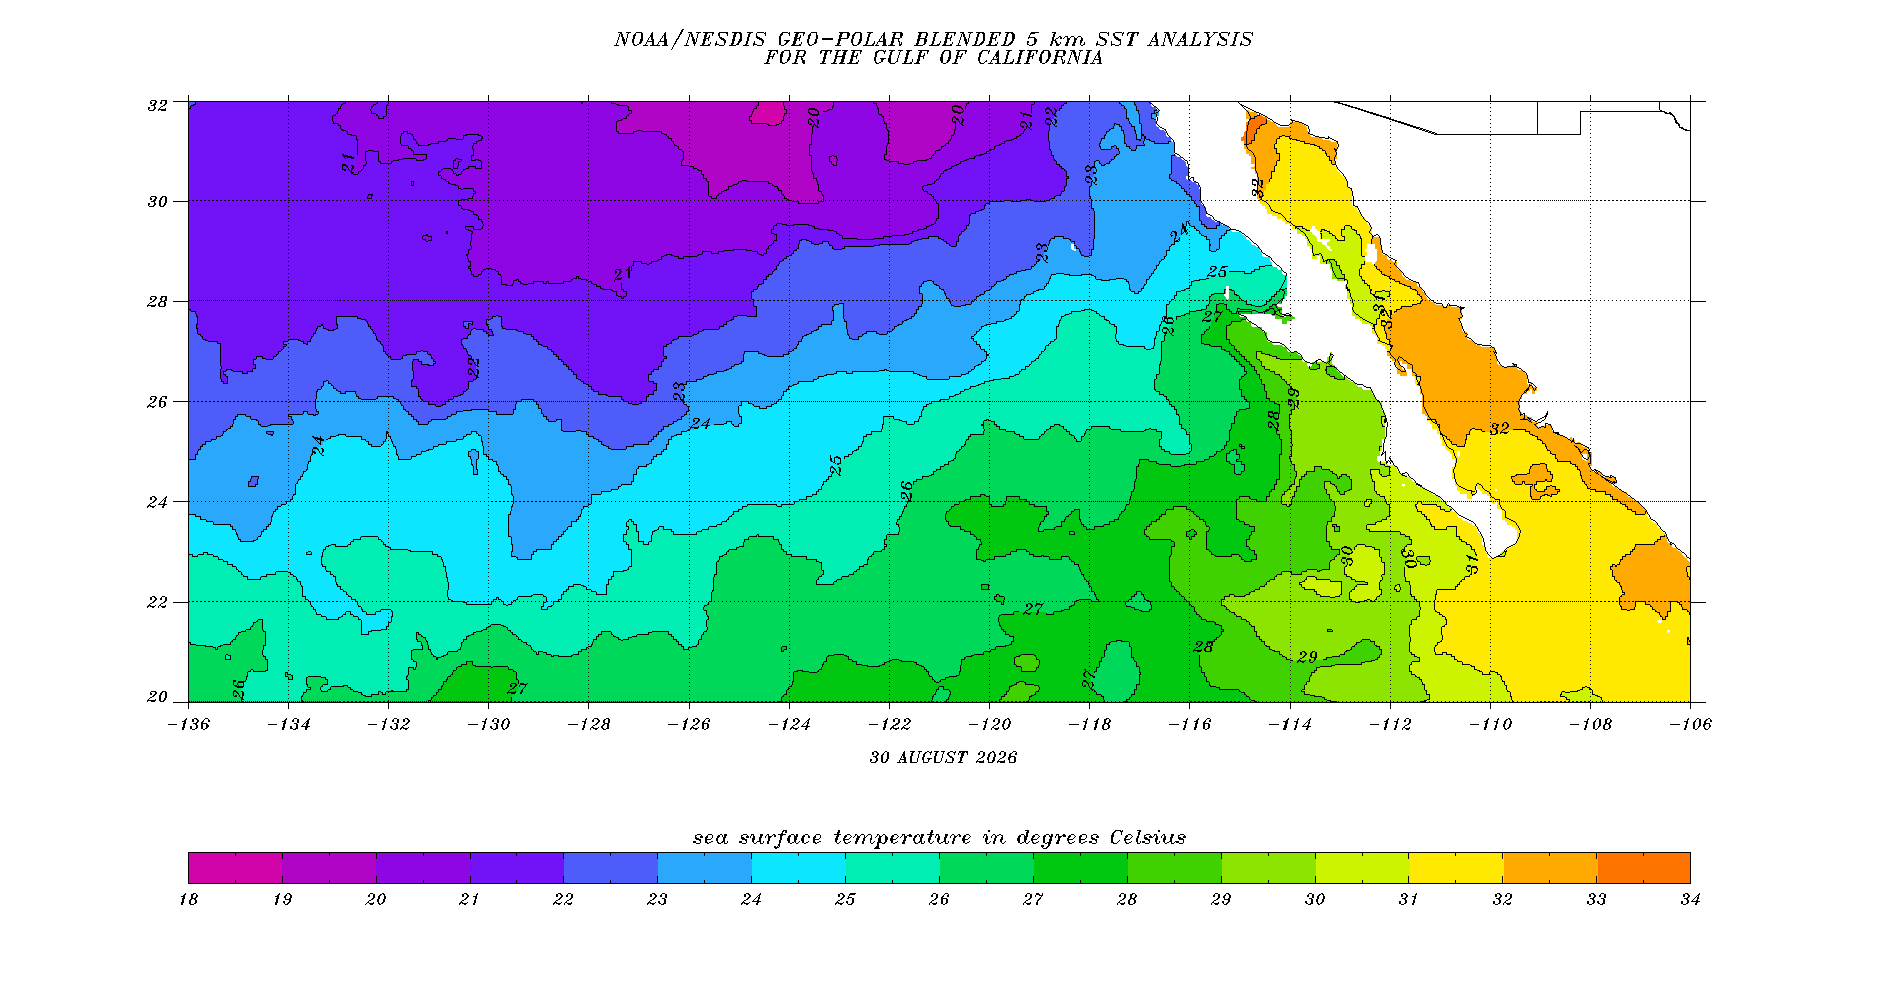
The waters are incredibly warm along the southern half of the Baja California Pacific coast, with 26.5 C or higher water. Usually this area has upwelling of colder water (with tight sea surface temperature gradients around Cabo San Lucas due to the hot water in the Gulf of California). Water along the northern Baja California coast is cooler, which would weaken any hurricane substantially before arriving in southern California (assuming the "perfect path"). Hurricane Hilary become non-tropical shortly before reaching southern California, though this had an over-the-land track over northern Baja California, including over mountains; yet the impacts were felt with very heavy rainfall (up to around 330 mm/13" locally) and flash flooding, along with areas of strong winds. Other tropical cyclones moving into or towards southern California had major rainfall impacts, including the direct hit from a tropical storm in Long Beach in 1939. It would be unlikely for coastal southern California to receive either a hurricane or tropical storm (not counting storms that transitioned to extra-tropical status) directly in any given year, but the possibility is there. The precipitation and flooding impacts would almost certainly far exceed the wind impacts with any storm (tropical or post-tropical) arriving in southern California. One note with Hilary--the water was somewhat cooler right before it moved through the region in August 2023 than it is now (the 26.5 C water did not reach the Punta Eugenia--the midpoint of the Baja California Pacific coast):
Regardless, with the chance of a tropical cyclone approaching southern California in about a week in some of the weather models, and the high sea surface temperatures, there is reason to be concerned, but again, the concern should be primarily over the heavy rain and flash flooding risk (especially if one is near a recent burn scar), which again could occur with just remnants of a tropical cyclone in the area.
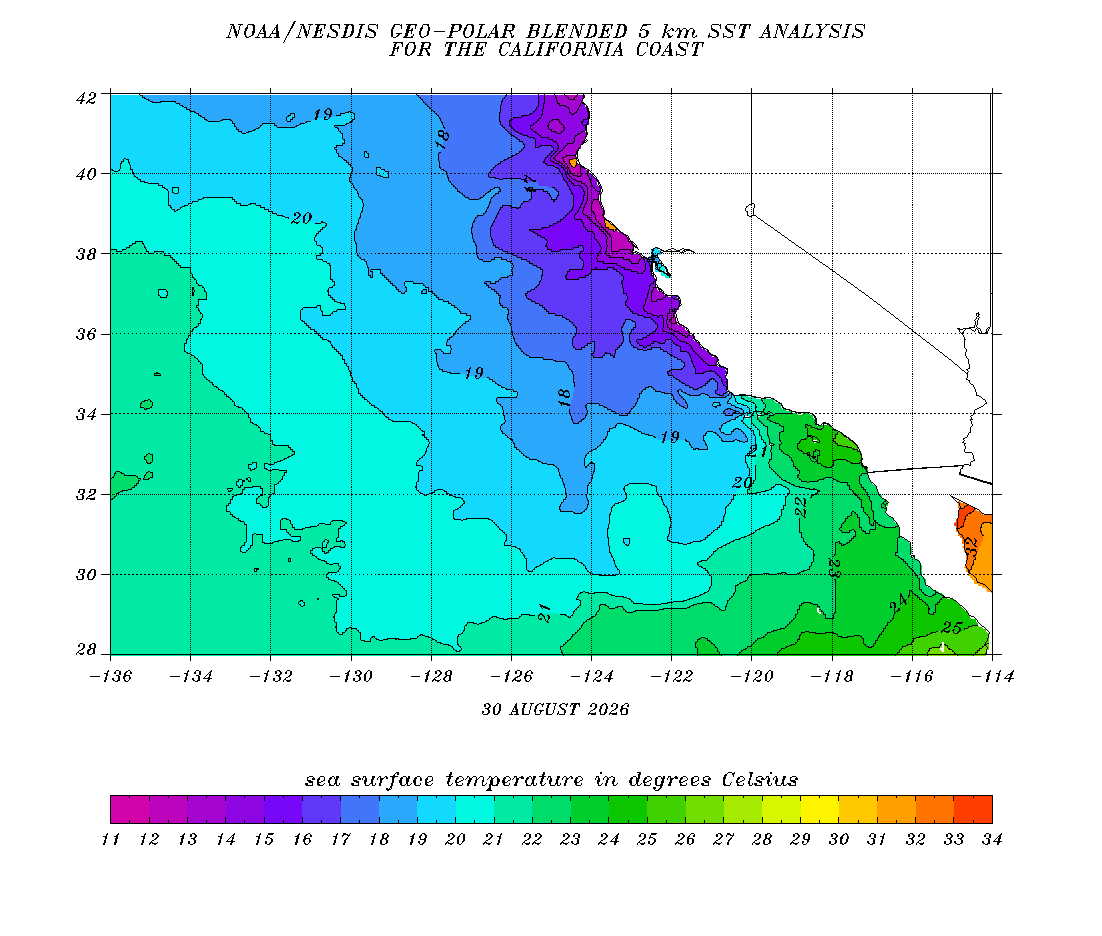
And for reference, here are the latest sea surface temperatures along the California coast. Temperatures are much higher, obviously, in southern California than in central and northern California as (like all summers) the upwelling of cold water is stronger up north. This has a strong effect on temperatures as the highest temperature at Half Moon Bay (Pacific Coast of San Mateo County, south of San Francisco) had its highest August 2026 temperature of 20 C/68 F. That was the lowest August 2026 temperature at San Diego International Airport. Fascinating comparison.
The big theme is obviously the greatly increasing water temperatures, including all-time records. This trend has been especially noteworthy since 2015, and it is associated with higher land temperatures as well. Climate models and scientific consensus is that this will continue, along with the increase in CO2 (remember that is something you can affect with your habits, such as how much you fly, how you power your car (I mostly use solar, and yes, decreasing driving is important too), what food you eat, among others, not to forget that organizations, including governments, need to change their habits and policies to reduce their carbon emissions).
Come back soon for analyses of weather and climate, anywhere from California to other parts of the US to around the world!
Some of the future topics will include:
The wettest atmospheres in the world (based on "precipitable water")
Timberlines (highest elevation that trees can grow in a mountain range) and climate
Maximum precipitation rates reported given a certain temperature
Case studies of unusual storms