Periodic analyses of weather and climate will be posted here, with links to previous editions at the bottom.
NEW: You can click on an image to see the original in full-size for easier viewing.
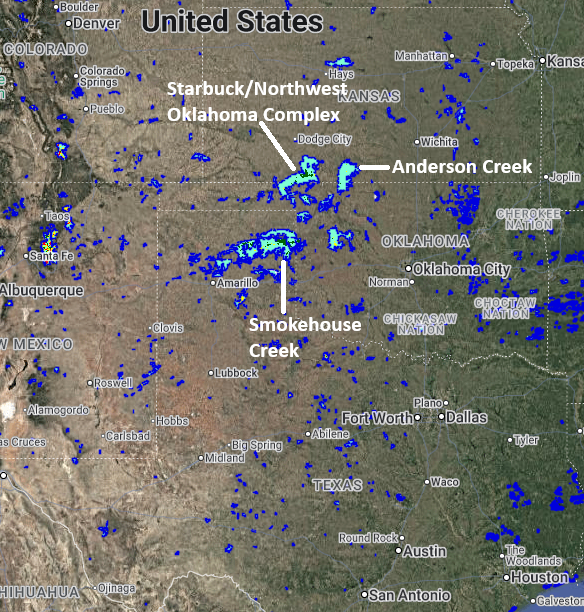
The southern Great Plains (from the Texas Panhandle to southwestern Kansas) gets a lot of large, fast-moving, wildfires in late winter and early spring. For the 10 years between 2016 and 2025, the Smokehouse Creek fire (2024) in the Texas panhandle was the fire with the greatest amount of acreage in the United States (1058482 acres/428352 hectares), while the Northwestern Oklahoma Complex (2017), most of which was also called the Starbuck Fire, which included not just northwestern Oklahoma but even more acreage in southwestern Kansas, was #5 among all 2016-2025 U.S. fires with 779292 acres/315368 hectares, and the Anderson Creek Fire (2026) in northwestern Oklahoma and south-central Kansas, was #9 with 400000 acres/160000 hectares. More recently, in February 2026 (and what inspired this blog entry), several fires broke out in Oklahoma and Kansas, including the Ranger Road Fire at 283283 acres/114641 hectares. Here's a map of at least the 2016 through 2024 wildfire burn areas over that general area (from https://lcms-viewer.fs2c.usda.gov/mtbs.html with the major fires labeled):
Why are these fires so big? We will look at the weather for each one below, but the gist is that the Southern Great Plains often has the right combination of strong winds, low humidity and low dry vegetation, which is not just a product of dry weather but also hard freezes in winter, often not accompanied by snow cover. Therefore, the grass is dormant and, combined with effects of the wind and periodic warm sunny weather, quite dry.
Smokehouse Creek Fire (2024):
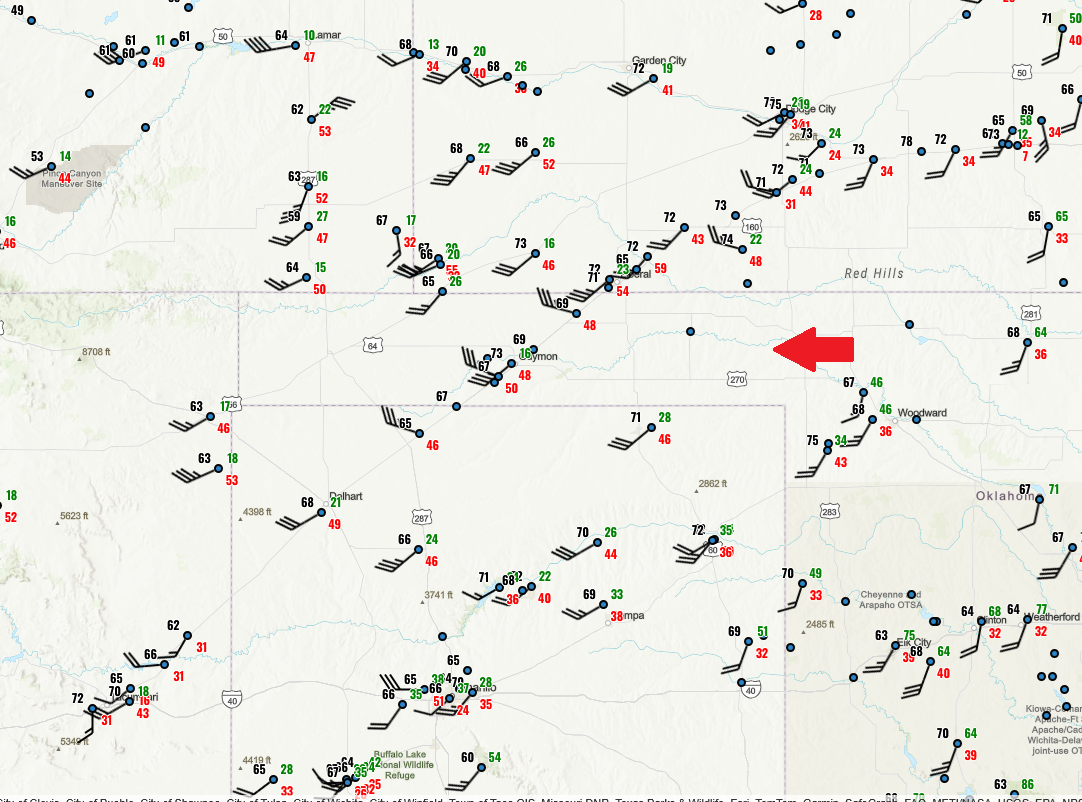
We will look at these fires from largest to smallest, so let's start with the Smokehouse Creek fire of 2024. The observation map (from the National Weather Service Weather and Hazards viewer archive) is from 2 PM CST 26 Feb 2024, shortly before the official ignition time of 220 PM, with ignition occurring where the red arrow points. In case you need a review on reading the wind barbs below, one is here: https://www.weather.gov/hfo/windbarbinfo. The numbers show the temperature (°F, in black, left of the dot), wind gust (MPH, in red, lower-right) and relative humidity (%, in green, upper-right). The wind barbs are in knots (1 knot=1.15 MPH), despite the gusts being listed in MPH.
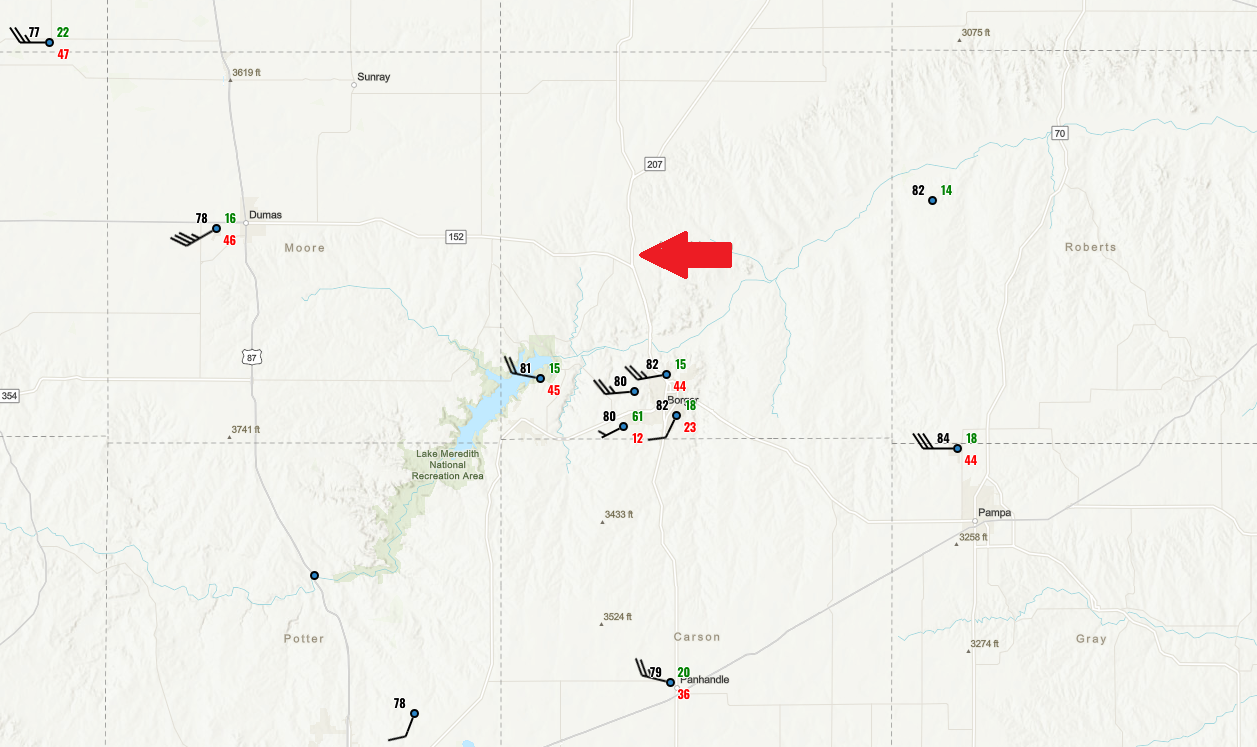
Winds were predominantly from the west with wind numerous gusts over 40 MPH, including two of the nearest stations to the south. Relative humidity was mostly between 15 and 20 percent, with those same two nearest stations at 15 percent, one of the thresholds in that part of the Great Plains for red flag warnings (issued by the National Weather Service for a high risk of wildfires given an ignition, whether natural (mostly lightning) or man-made) with wind speed being the other (generally 20 or 25 MPH sustained and 35 MPH for gusts).
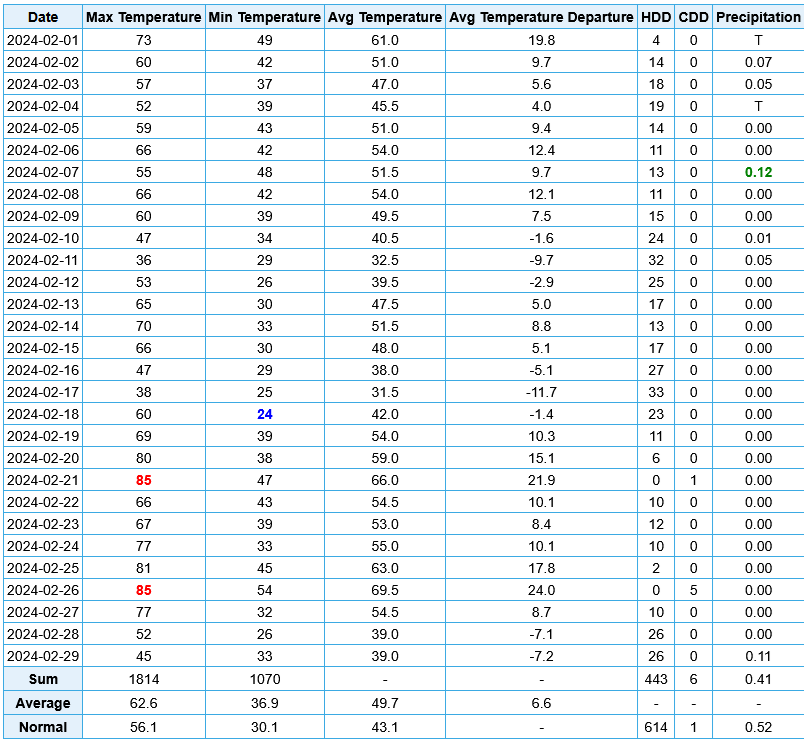
It is also important to look at the climate data for the month of February 2024. We will look at the data for Borger, a little over 10 miles (16 km) south of where the Smokehouse Creek fire started. The average temperature for February 2024 was 6.6° F/3.7° C above normal with only 0.30" (8 mm) of precipitation in the first 26 days of the month (leading up to the fire). While there were no extremely low temperatures that month (lowest was 24° F/-4° C), there were 4 days in mid-January with low temperatures in the single digits (lowest was 2° F/-17° C) which would have assured dormancy. The station at Borger doesn't report snowfall, but Amarillo, approximately 40 miles (64 km) to the southwest of Borger, received 5.6 inches (14 cm) on 11 Feb 2024, but Borger likely received very little snow given that only 0.05" (1 mm) of precipitation fell, and if any snow fell, it would not have remained on the ground long (measurable snow was only on the ground for 2 days at Amarillo, and during the rest of the fall and winter of 2023-2024, Amarillo had less than 2 inches (5 cm) of snowfall). Despite this, the Drought Monitor had no drought for the area affected by the Smokehouse Creek Fire (not even "D0" for "abnormally dry"), and drought is not a requirement for parched vegetation in that area given that there is not normally much precipitation at that time of year (the average for February is 0.52" (13 mm)), and vegetation will be dormant anyway due to the winter freezes.
Starbuck/Northwest Oklahoma Complex Fire (2017):
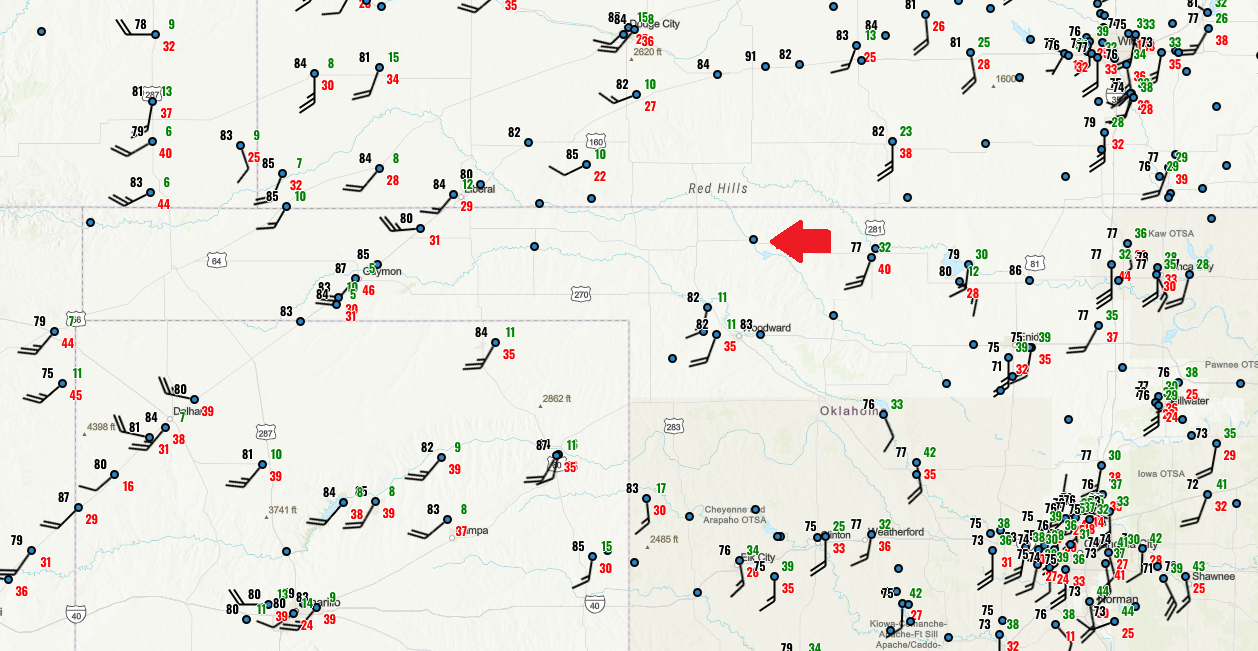
Here are the observations at 11 AM CST 6 Mar 2017 near the origination of the Starbuck Fire, the largest part of the Northwest Oklahoma Complex Fire.
There widespread strong winds with many gusts over 40 MPH, some over 50 MPH. Humidity was not quite as low though, mostly in the 20s for percent (higher to the east, as usual), which given preexisting dry vegetation, makes me think that the wind is a most important factor for the large Great Plains wildfires, even more so than relative humidity. Also, humidity can vary substantially around the U.S. for what is considered critical for fire weather (many parts of the western US have 15 percent as the threshold when accompanied by strong wind, but in parts of Florida, 35 percent is considered the critical threshold during windy periods).
Anderson Creek Fire (2016):
Here are the observations at 3 PM CST 22 Mar 2016 near the origination of the Anderson Creek Fire, which started about 3 hours later.
There was a rather sharp contrast in relative humidity near the location of the fire start, with humidity between 10 and 15 percent nearby, below 10 percent in some areas to the west, but humidity was higher just to the east, 30 to 40 percent. Note that three hours later, the humidity had increased considerably to 30 to 40 percent, but that could not overcome the effects of the dry air earlier, especially as the winds continued, and therefore the Anderson Creek fire expanded rapidly.
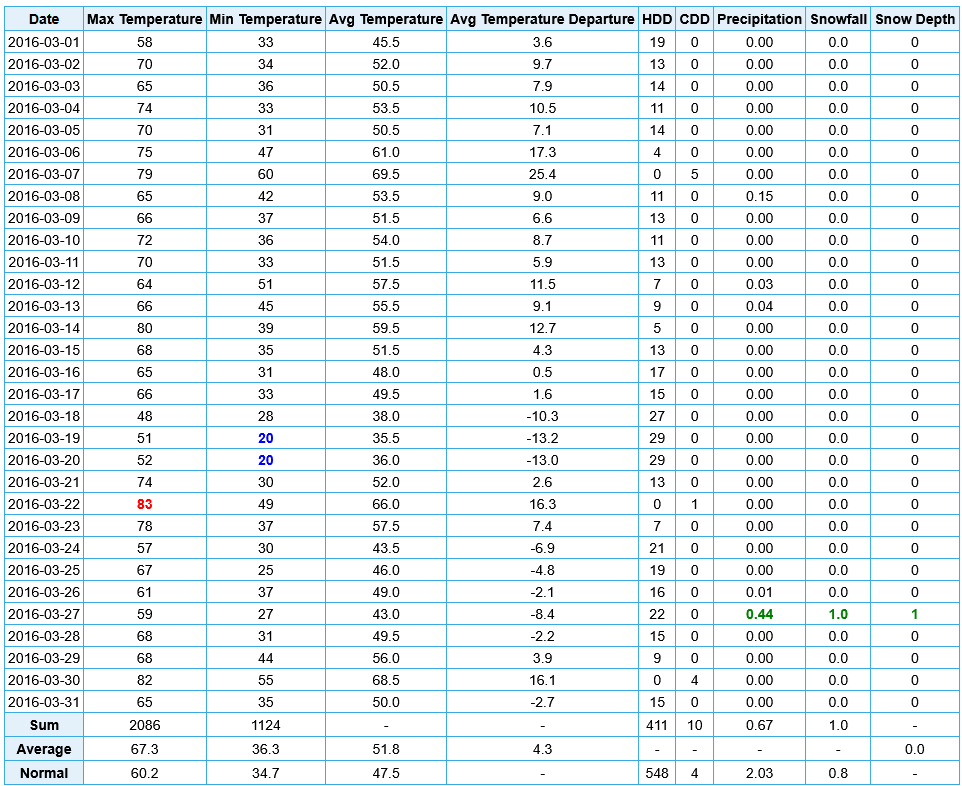
Also, look at the climate data for March 2016 at nearby Medicine Lodge, Kansas. Like with the other wildfires, March 2016 was mostly dry up to the point of the fire (just 0.22"/6 mm of precipitation, and February 2016 was also dry with 0.38"/10 mm, or about 1/3 of normal), with a lot of temperature whiplash. THe mornings of 19 and 20 Mar 2016 had lows of 20 F/-7 C, well below freezing, followed by the warmest day of March on the day of the ignition, with a high of 83 F/28 C.
Ranger Road Fire (2026):
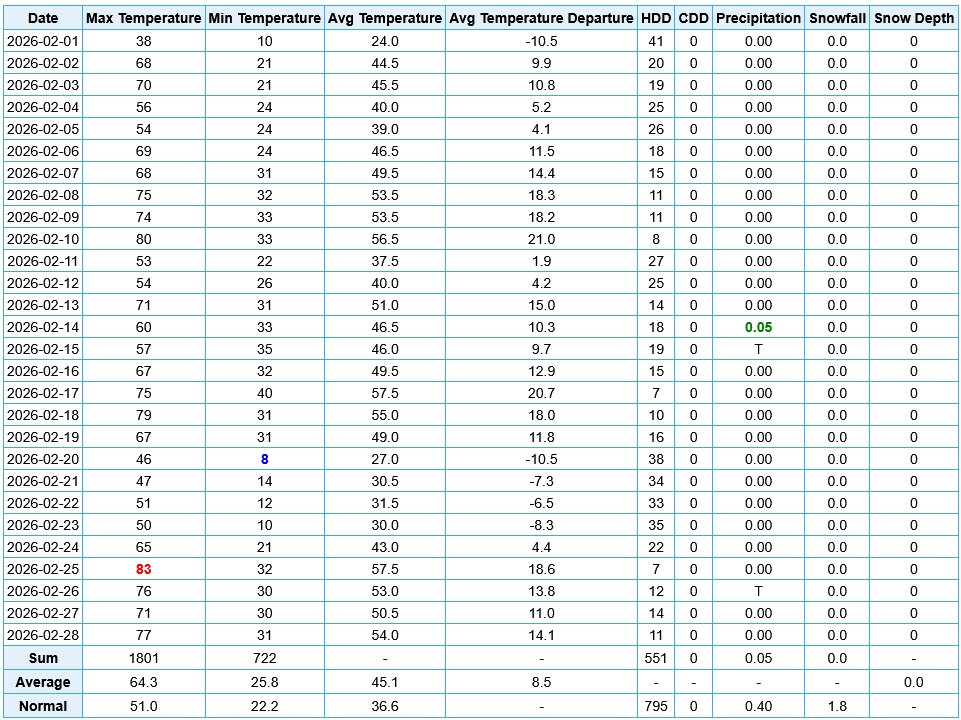
Now we go to the recent fire, the Ranger Road Fire, which started in the Oklahoma Panhandle, very close to Beaver, and rapidly spread to the northeast into Kansas with more than half its 283283 acre/114641 hectare coverage having been burned in the first nine hours. Here are the observations at 11 AM CST 17 Feb 2026 near the Ranger Road Fire, about 40 minutes before ignition.
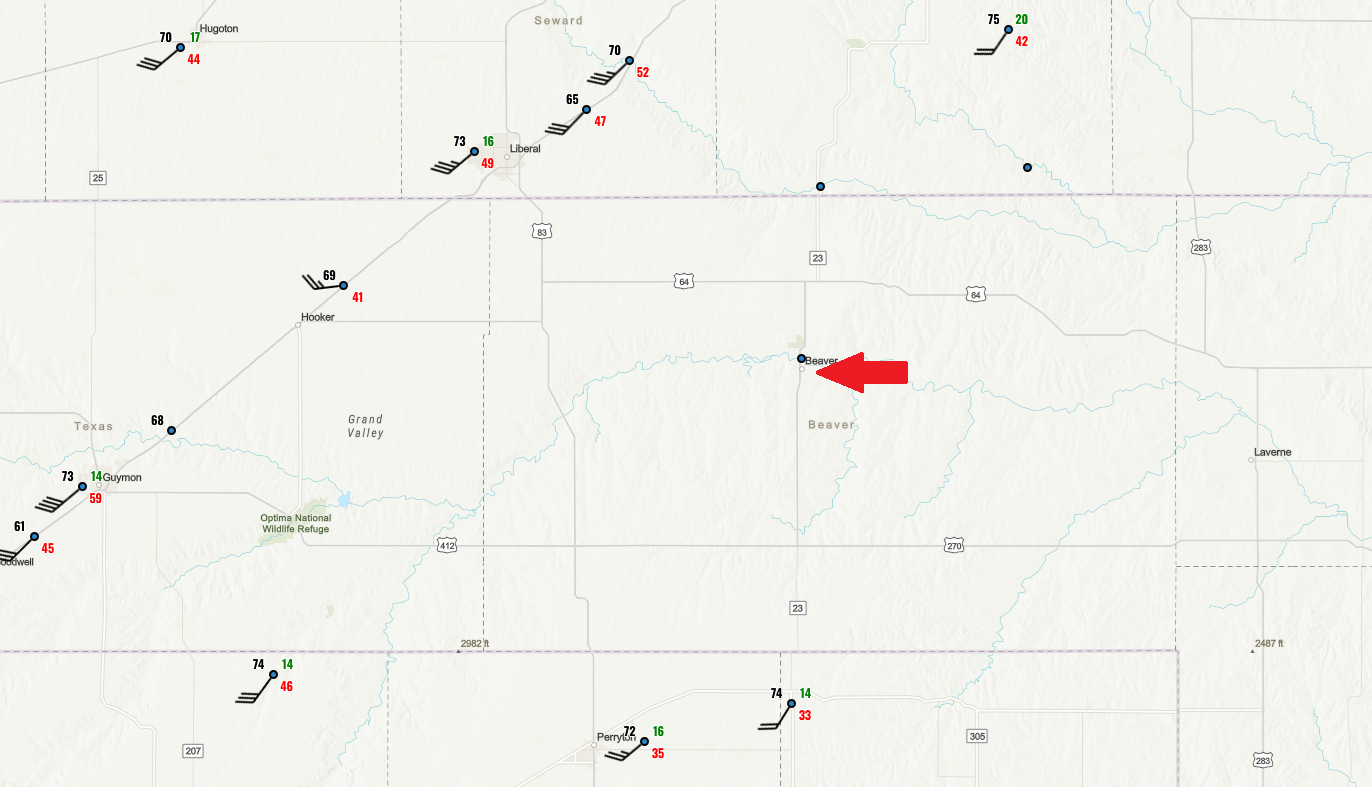
This is another obvious case of strong winds, with many gusts over 40 MPH across the region, and low humidity of around 15 percent. While Beaver, which is very near the starting point, did not appear on this map, but the Oklahoma Mesonet reported a gust there of 53 MPH at 10 AM CST and 56 MPH at 1 PM CST with a relative humidity at both times of 12 percent. Antecedent conditions were dry based on the climate data for February 2026 to the northwest at Liberal, Kansas, with only 0.05" (1 mm) for the month. Periodic freezes, including deep freezes, combined with the relative dryness to keep the grass dormant. This included a low of 10 F/-12 C on 1 Feb 2026 with no snow cover, and four nights in a row had lows below 0 F/-18 C in late January, though there was snow cover then (around 4"/10 cm) which melted quickly as much warmer conditions came shortly thereafter.
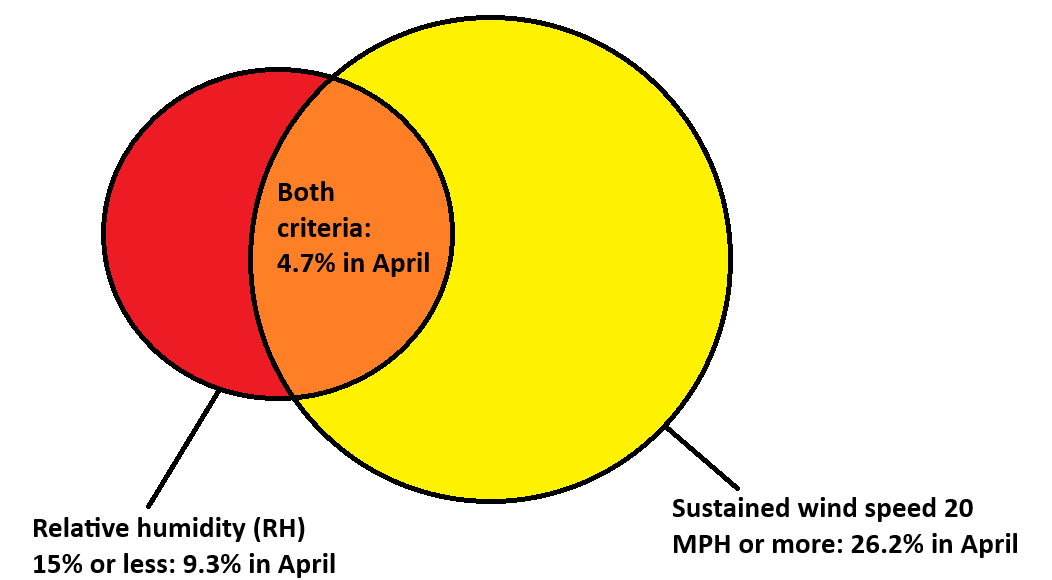
Now that we have seen the examples of strong winds and low humidity during the initiation of wildfires, we must ask how frequent these conditions are. In parts of the southern Plains, they are very frequent in late winter and spring, though much less frequent at other times of year. This is especially the case in the northern part of the Texas Panhandle; for example, Amarillo, Texas in April has sustained winds of 20 MPH or more (not even counting gusts!) 26.2% of the time, and relative humidity is 15 percent or less 9.3% of the time, based on hourly observations at the airport. The combination of the two occurs 4.7% of the time, which is equivalent to 34 hours per month, which is a lot of hours of critical fire weather.
Below is the table showing each month in Amarillo, with the percentages of time with sustained wind at least 20 MPH, relative humidity 15% or less, the combination of the two (at the same time), and the average monthly precipitation. One can easily see that winter is the dry season, with the greatest risk of large wildfires coming towards the end of the dry season, aided by the stronger winds and lower humidity in late winter and early spring. Note that average precipitation steadily increases during spring, and is more reliable, making large wildfires somewhat less likely even while high winds and low humidity remain frequent. Note that while the average precipitation data below are for the 30 year period from 1991-2020, the all-time records going back to 1892 indicate that 12 of the Februaries had less than 0.04" (1 mm) of precipitation, 14 of the Marches had less than 0.04", but only 5 Aprils and no Mays were in that category. (For fun, note that June 1965 had 10.73"/273 mm, so it can really rain a lot there with the right weather pattern.)
Amarillo:

Month      % of Time with Sustained  % of Time with Humidity  % of Time with Both Wind 20 MPH+  Average Monthly
           Wind at Least 20 MPH      15% or Less              and Humidity 15% or Less          Precipitation

January    14.2                       2.4                      0.9                              0.70" (18 mm)
February   17.4                       4.6                      2.0                              0.53" (13 mm)
March      21.6                       7.2                      3.0                              1.27" (32 mm)
April      26.2                       9.3                      4.7                              1.45" (37 mm)
May        19.8                       7.9                      2.8                              2.27" (58 mm)
June       20.0                       3.8                      1.4                              2.85" (72 mm)
July        9.5                       0.7                      0.1                              2.82" (72 mm)
August      7.0                       0.5                      0.1                              2.86" (73 mm)
September  10.8                       0.9                      0.1                              1.69" (43 mm)
October    14.7                       2.0                      0.6                              1.75" (44 mm)
November   15.9                       2.3                      0.8                              0.75" (19 mm)
December   15.0                       1.7                      0.6                              0.70" (18 mm)
A little farther south, Lubbock had an amazing 5.1 percent of the time in April with the combination of wind at least 20 MPH and humidity 15 percent or less (while wind was less frequent there, relative humidity was lower, partly because of higher average temperatures). This was the major station with the highest percentage that I found in that region.
In comparison, below is Liberal, Kansas. The timing of winds and low humidity are similar, though with less extreme fire weather conditions being a bit farther norht, especially with regard to amount of time with low humidity (less than half of Amarillo's during most months of the year). The difference between the dry and wet seasons is even more apparent at Liberal though. Like with Amarillo, the time with the lowest likelihood of strong winds and low humidity is in summer (a bit counterintuitive, but humidity (or "mugginess") from the Gulf of Mexico can extend quite far to the west at times during summer in the Great Plains, sometimes reaching parts of far eastern Colorado and even far eastern New Mexico.
Liberal:

Month      % of Time with Sustained  % of Time with Humidity  % of Time with Both Wind 20 MPH+  Average Monthly
           Wind at Least 20 MPH      15% or Less              and Humidity 15% or Less          Precipitation

January    10.6                       0.8                      0.3                              0.44" (11 mm)
February   15.5                       1.8                      0.6                              0.39" (10 mm)
March      19.7                       3.2                      1.3                              1.20" (30 mm)
April      23.9                       4.3                      2.1                              1.74" (42 mm)
May        20.5                       2.8                      1.5                              2.62" (67 mm)
June       21.8                       1.4                      0.7                              3.17" (81 mm)
July       10.4                       0.1                      0.1                              3.14" (70 mm)
August      7.4                       0.2                      less than 0.1                    2.68" (68 mm)
September  13.1                       0.5                      0.1                              1.53" (39 mm)
October    14.6                       1.1                      0.3                              2.28" (58 mm)
November   14.2                       0.5                      0.1                              0.73" (19 mm)
December   12.0                       0.6                      0.3                              0.80" (20 mm)
One complication of the weather patterns: they never quite look the same for each of the major wildfires. See the daily weather maps below (from the National Weather Service's Weather Prediction Center (https://www.wpc.ncep.noaa.gov/dailywxmap/--an easy reference for archived surface and 500 millibar (approx. 4 miles/6 km above the surface) maps) to see the variety of surface patterns for the four early mornings before the above mentioned wildfire starts (remember to click on the map for a bigger image, necessary in this case, and the order is 22 Mar 2016 (upper-left), 6 Mar 2017 (upper-right), 26 Feb 2024 (lower-left), and 17 Feb 2026 (lower-right)):
In general, there is strong low pressure to the north or northwest to help drive the wind with the Southern Plains being in the warm sector, but in only two of the cases was there a full-fledged cold front to the west. In all cases, there was surface low-pressure troughing in the region as well as a dew point gradient (lower values to the west, higher values to the east), and in summer (when thunderstorms are much more common and critical fire weather is much less common) there is often a dry line in these areas, which often marks a sharper contrast between the dry air to the west and often very humid air to the east.
Southern Great Plains fires burn very rapidly due to the vegetation as it is mostly grass, herbs and small shrubs (especially in the Texas Panhandle where honey mesquite is common). There are relatively few wind breaks, so embers can be carried long distances, and the dry grass burns fast. Given the time of year, even if the past year had sufficient rains, the freezing temperatures and generally dry conditions in winter will bring the dry fuels required for large wildfires. Once spring arrives (April and May especially), the threat of wildfires decrease due to increasing precipitation and decreasing risk of freezing temperatures, even though it takes some time for wind speeds to decrease. Of course, just because you have a pattern conducive to large wildfires does not mean one will happen, since if there is no ignition, then there will be no wildfire, even if the humidity is 8 percent, and the winds are gusting to 50 MPH. During red flag warnings, some people and organizations will curtail activities (including things like digging or cutting with heavy machinery or outdoor welding) that could create a spark. Of course, one of the unpopular but effective things that some power companies do is to have public safety power shutoffs when fire weather conditions are at their worst to reduce the change of a spark from a power line being affected by the wind. And please, never throw cigarette butts or drag a chain, such as with a vehicle pulling trailer, when there is any wildfire threat (if you're throwing out cigarette butts from your car, please tell me so I can give you a long annoying lecture, and believe me, one of my "superpowers" is the ability to be annoying if I shall choose!).
Come back soon for analyses of weather and climate, anywhere from California to other parts of the US to around the world!
Some of the future topics will include:
The wettest atmospheres in the world (based on "precipitable water")
Timberlines (highest elevation that trees can grow in a mountain range) and climate
Maximum precipitation rates reported given a certain temperature
Ways for anyone to get "strange" climate data online
Case studies of unusual storms