Periodic analyses of weather and climate will be posted here, with links to previous editions at the bottom.
I was going to focus on international weather for this blog entry, but I decided instead to highlight the heatwave of the southwestern and central United States from March 2026 instead (the blog entry for weather outside the US will come soon though, though I do stray outside the US here in a few places). After all 4 stations in California and Arizona recorded a temperature of 112 F (44 C) in March, which was 4 F (2 C) higher than the pre-2026 all-time record high March temperature of 108 F (42 C) set at two stations in Texas. NOAA put out a statement Wednesday (8 Apr 2026) describing March 2026 as being not just the most anomalously warm March in the history of the continental/contiguous (lower 48) United STates (from here on, referred to as the "CONUS", a term meteorologists frequently use) but the most anomalously warm MONTH in history for the CONUS. March 2026 was 5.2 C (9.35 F) above the 20th Century March average, exceeding the previous record set (at the time, also for any month of the year) in March 2012 (we'll look at that month as well in this article) of 4.9 C (8.9 F). See https://www.ncei.noaa.gov/news/national-climate-202603 for their analysis. I will note that March is a highly variable month with frequent clashes between warm and cold (including March 2026), so it is not surprising that the two months in the history of the CONUS with the greatest positive average temperature anomaly both came in March.
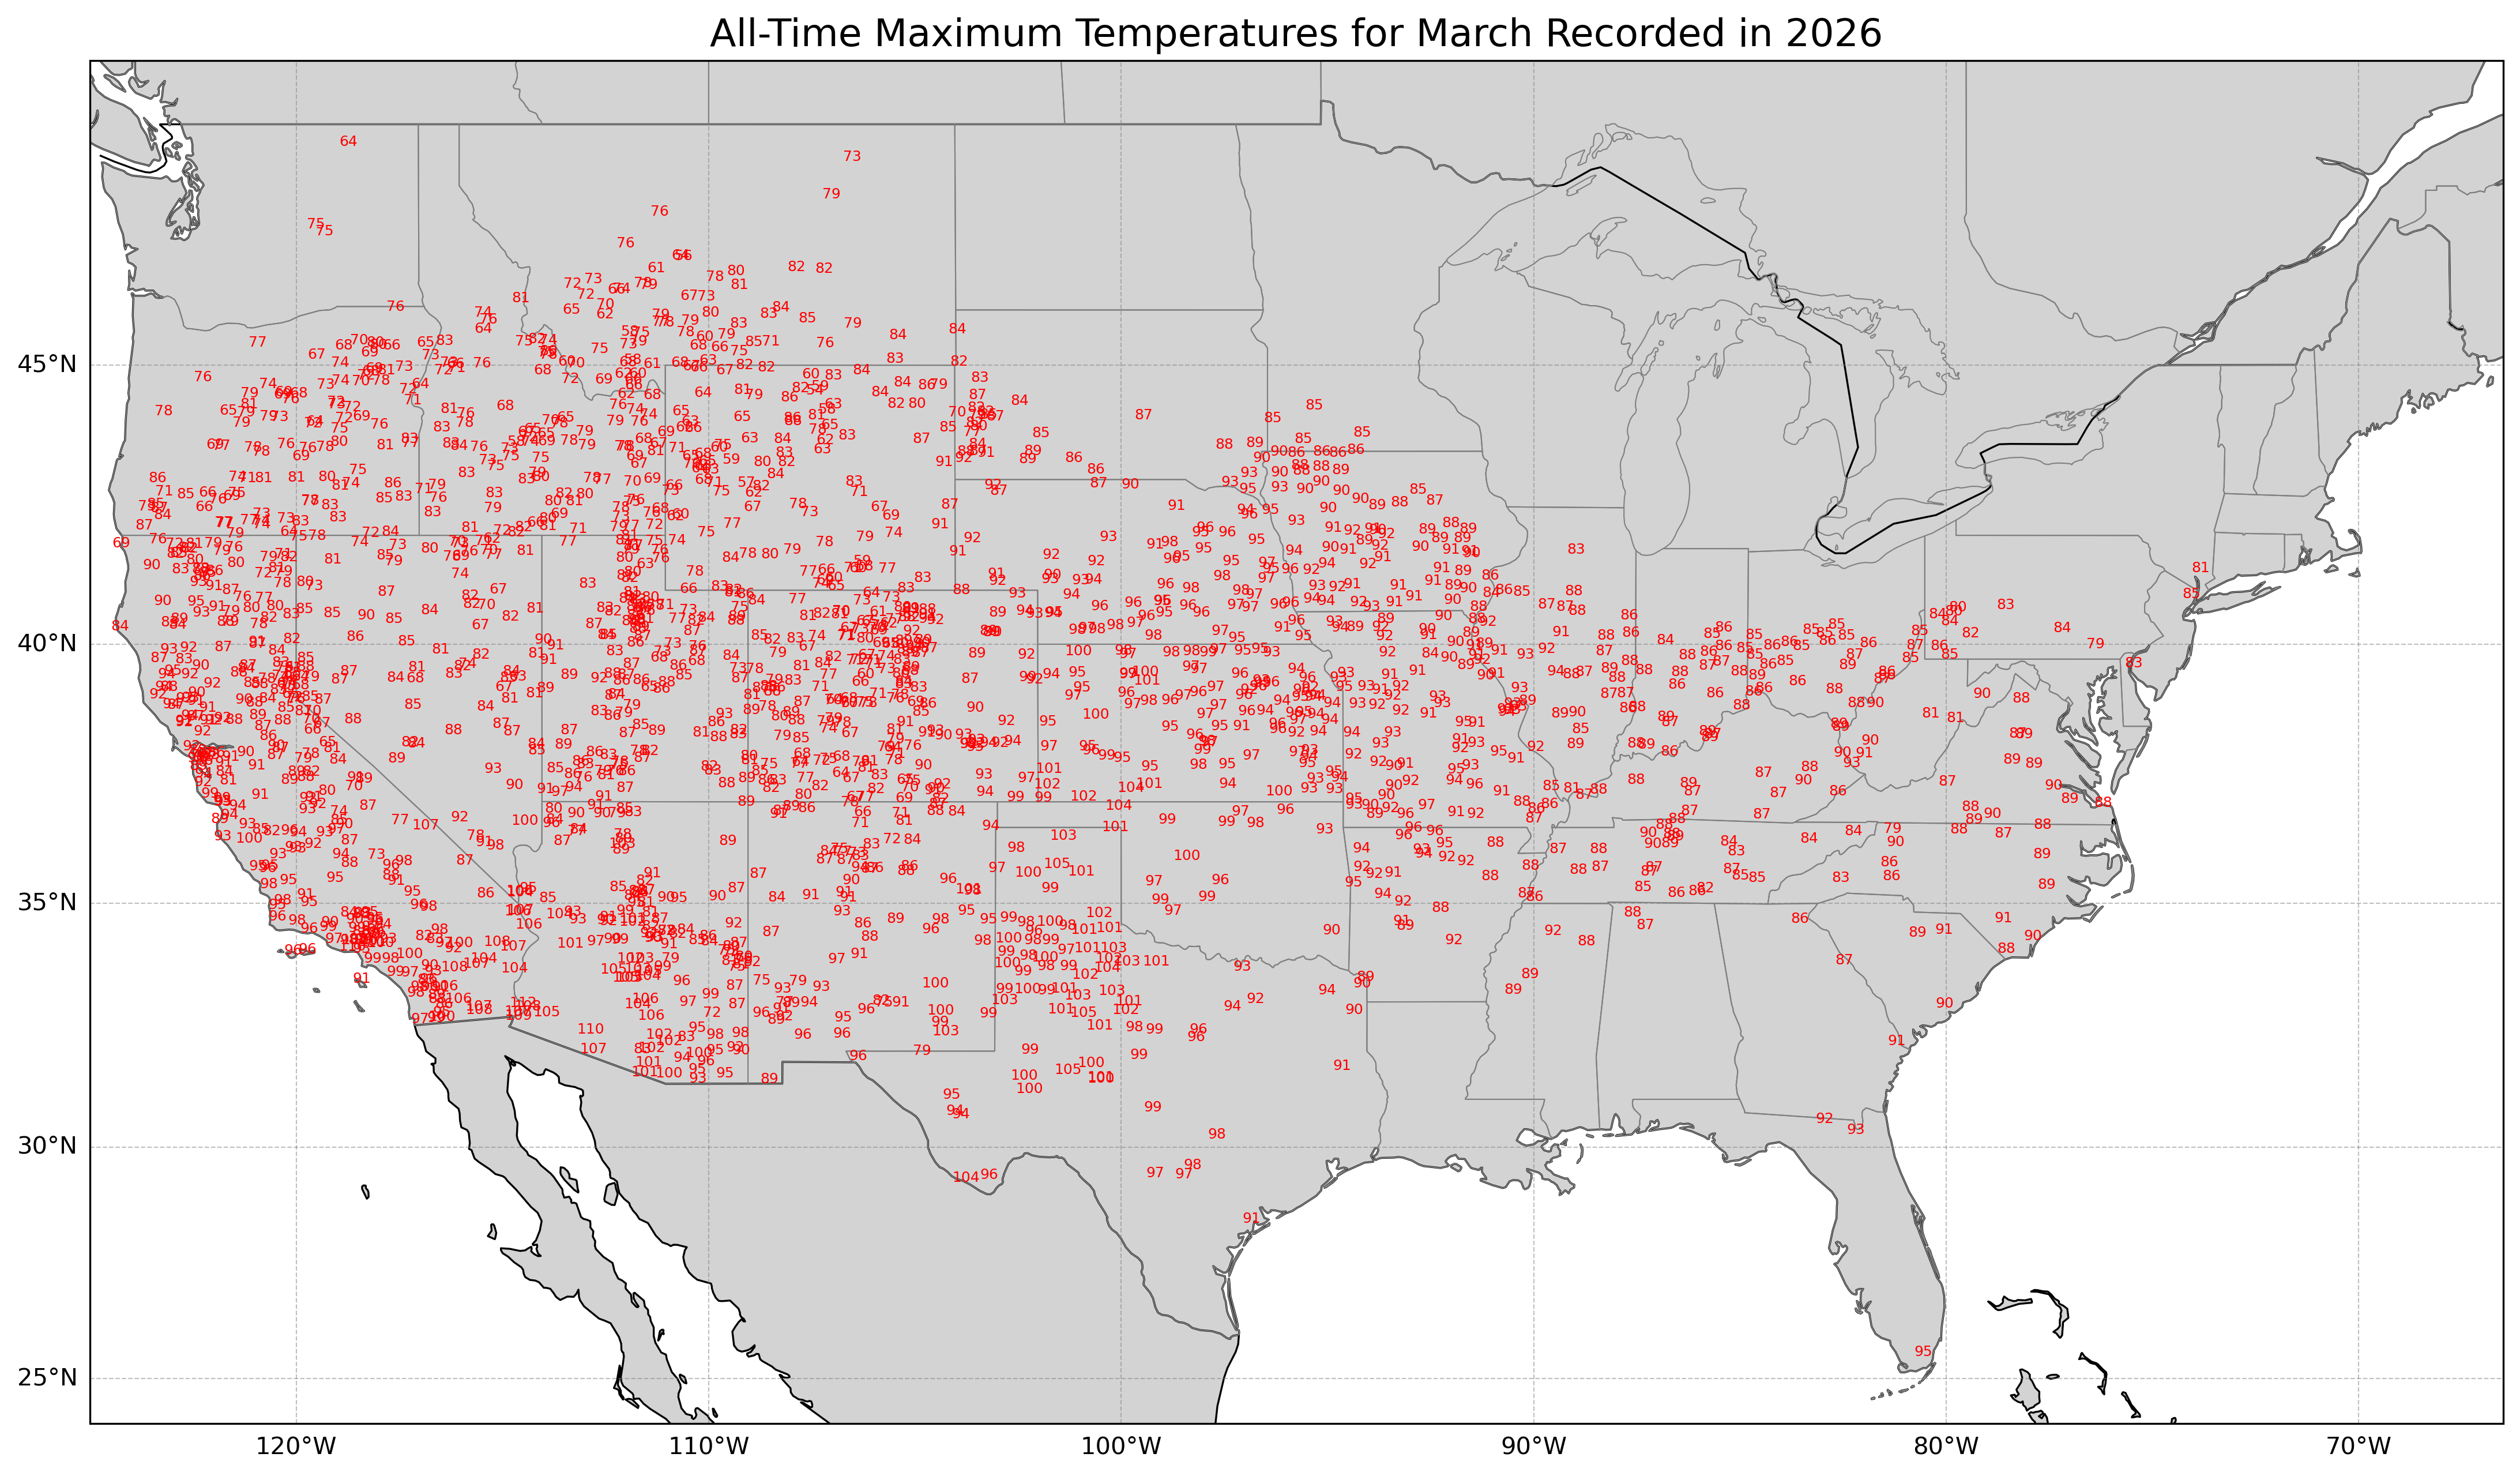
First, let's look at the weather stations across the US (and a few parts of southern California) with at least 30 years of data (and fewer than 3 days of missing daily data in March 2026) to see where all-time record high temperatures occurred for any day in March, not just in 2026 but for four other years that had a lot of all-time record March highs:
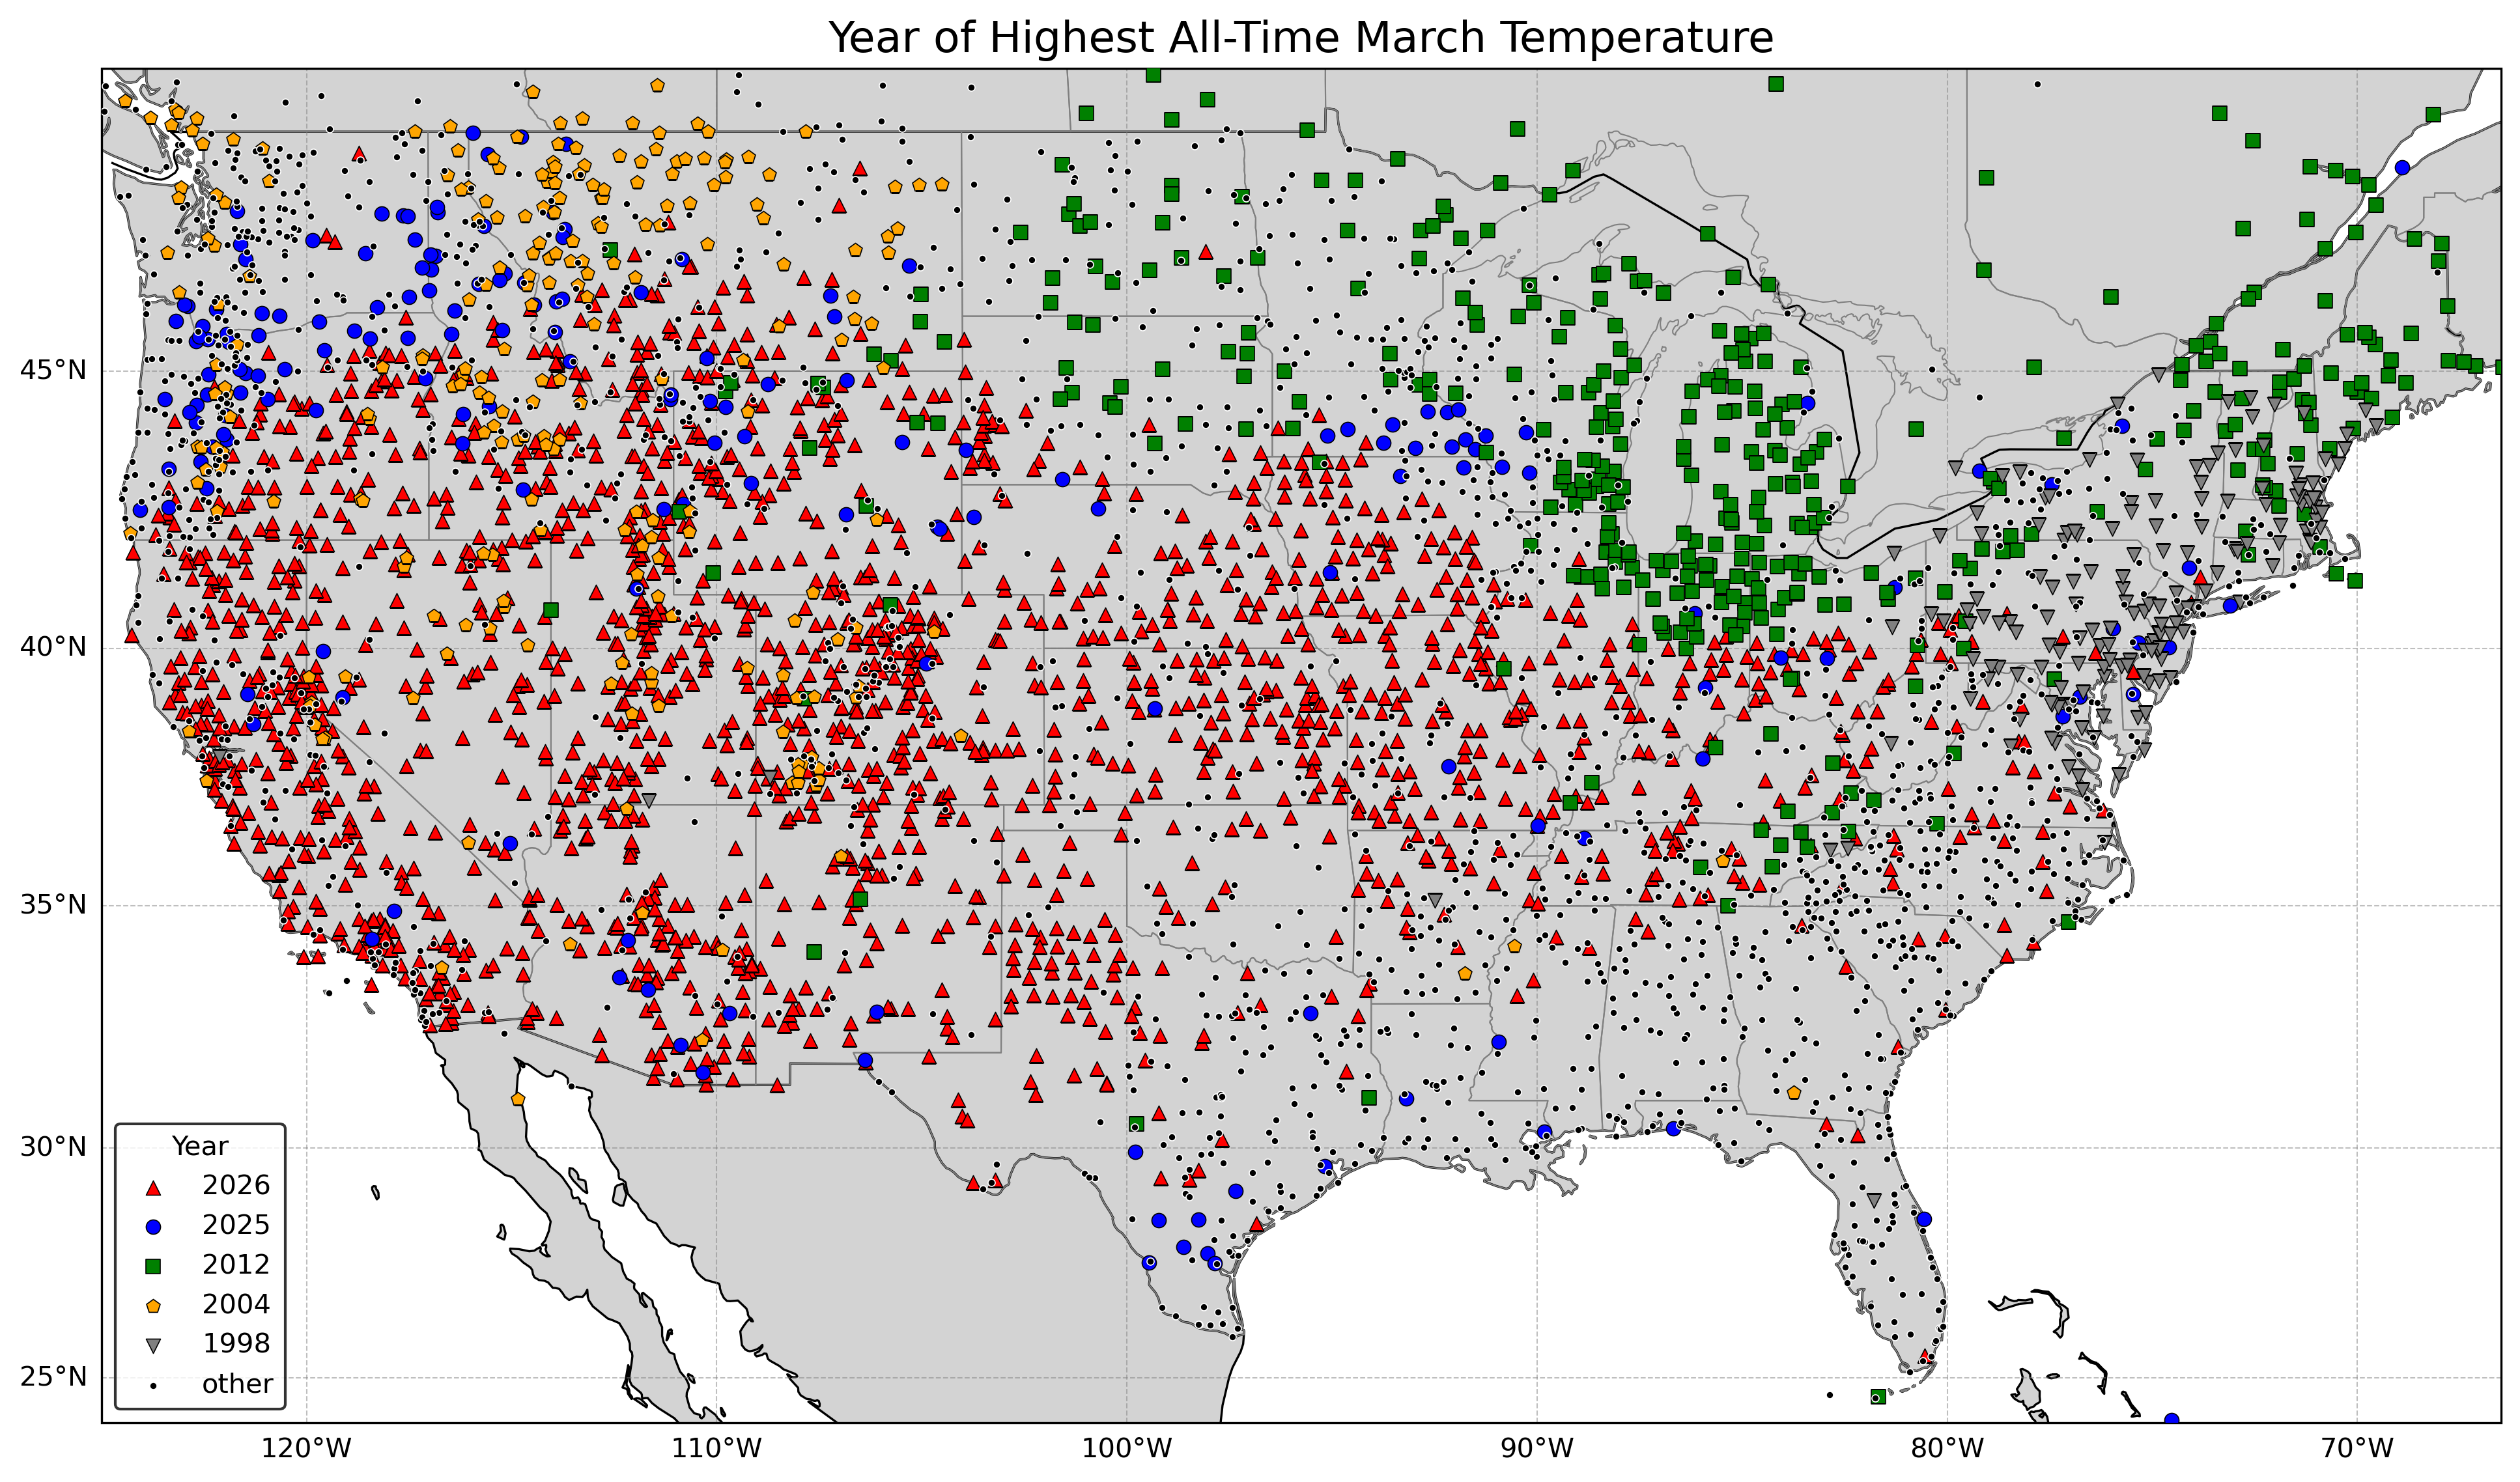
There were a total of 1834 locations out of 4622 that had their all-time March record high temperature in 2026, and 2026 "wins" by a long shot. Here are the top 5 years:
Rank       Year         Number of All-Time March
                        Record High Temperatures

1.         2026                 1834
2.         2012                  412
3.         2004                  243
4.         2025                  182
5.         1998                  172

All other years                 1779
While all of the above years are in the past 30 years, there were some notable extremes farther in the past. What if we just look at stations with temperature records going back to at least 1910 (one of the heat wave years)? This is what the table would look like.
Rank       Year         Number of All-Time March
                        Record High Temperatures

1.         2026                  348
2.         2012                  102
3.         1907                   90
4.         1910                   72
5.         1929                   70

All other years                  421
2026 still "wins" by a long shot, though March heat waves of 1907, 1910 and 1929 were notable (some of the data viewed for these stations go back into the 1800s).
We will now look up a bit into the atmosphere at a chart that meteorologists frequently view, the 850 hectopascal (hPa) or 850 millibar (mb) temperatures. Note that a typical sea level pressure is a little over 1000 hPa (equating to around 30 inches of mercury in a traditional barometer), so we are looking at where the atmosphere has a little less than 85% of the pressure of that at sea level, which corresponds to a (somewhat varying height) averaging around 1450 meters (4800 feet) above sea level (note in the map, where the elevation is above 1450 meters (or above the 850 hPa level), such as in most parts of the Rocky Mountains, the surface is used). Here we will look at the highest temperature between 1940 and 2026 in March at that elevation (in degrees C) in the free atmosphere based on the ERA-5 reanalysis (related to the ECMWF model, with data here used every 12 hours). The shading depicts the locations that reached that highest temperature in 2026.
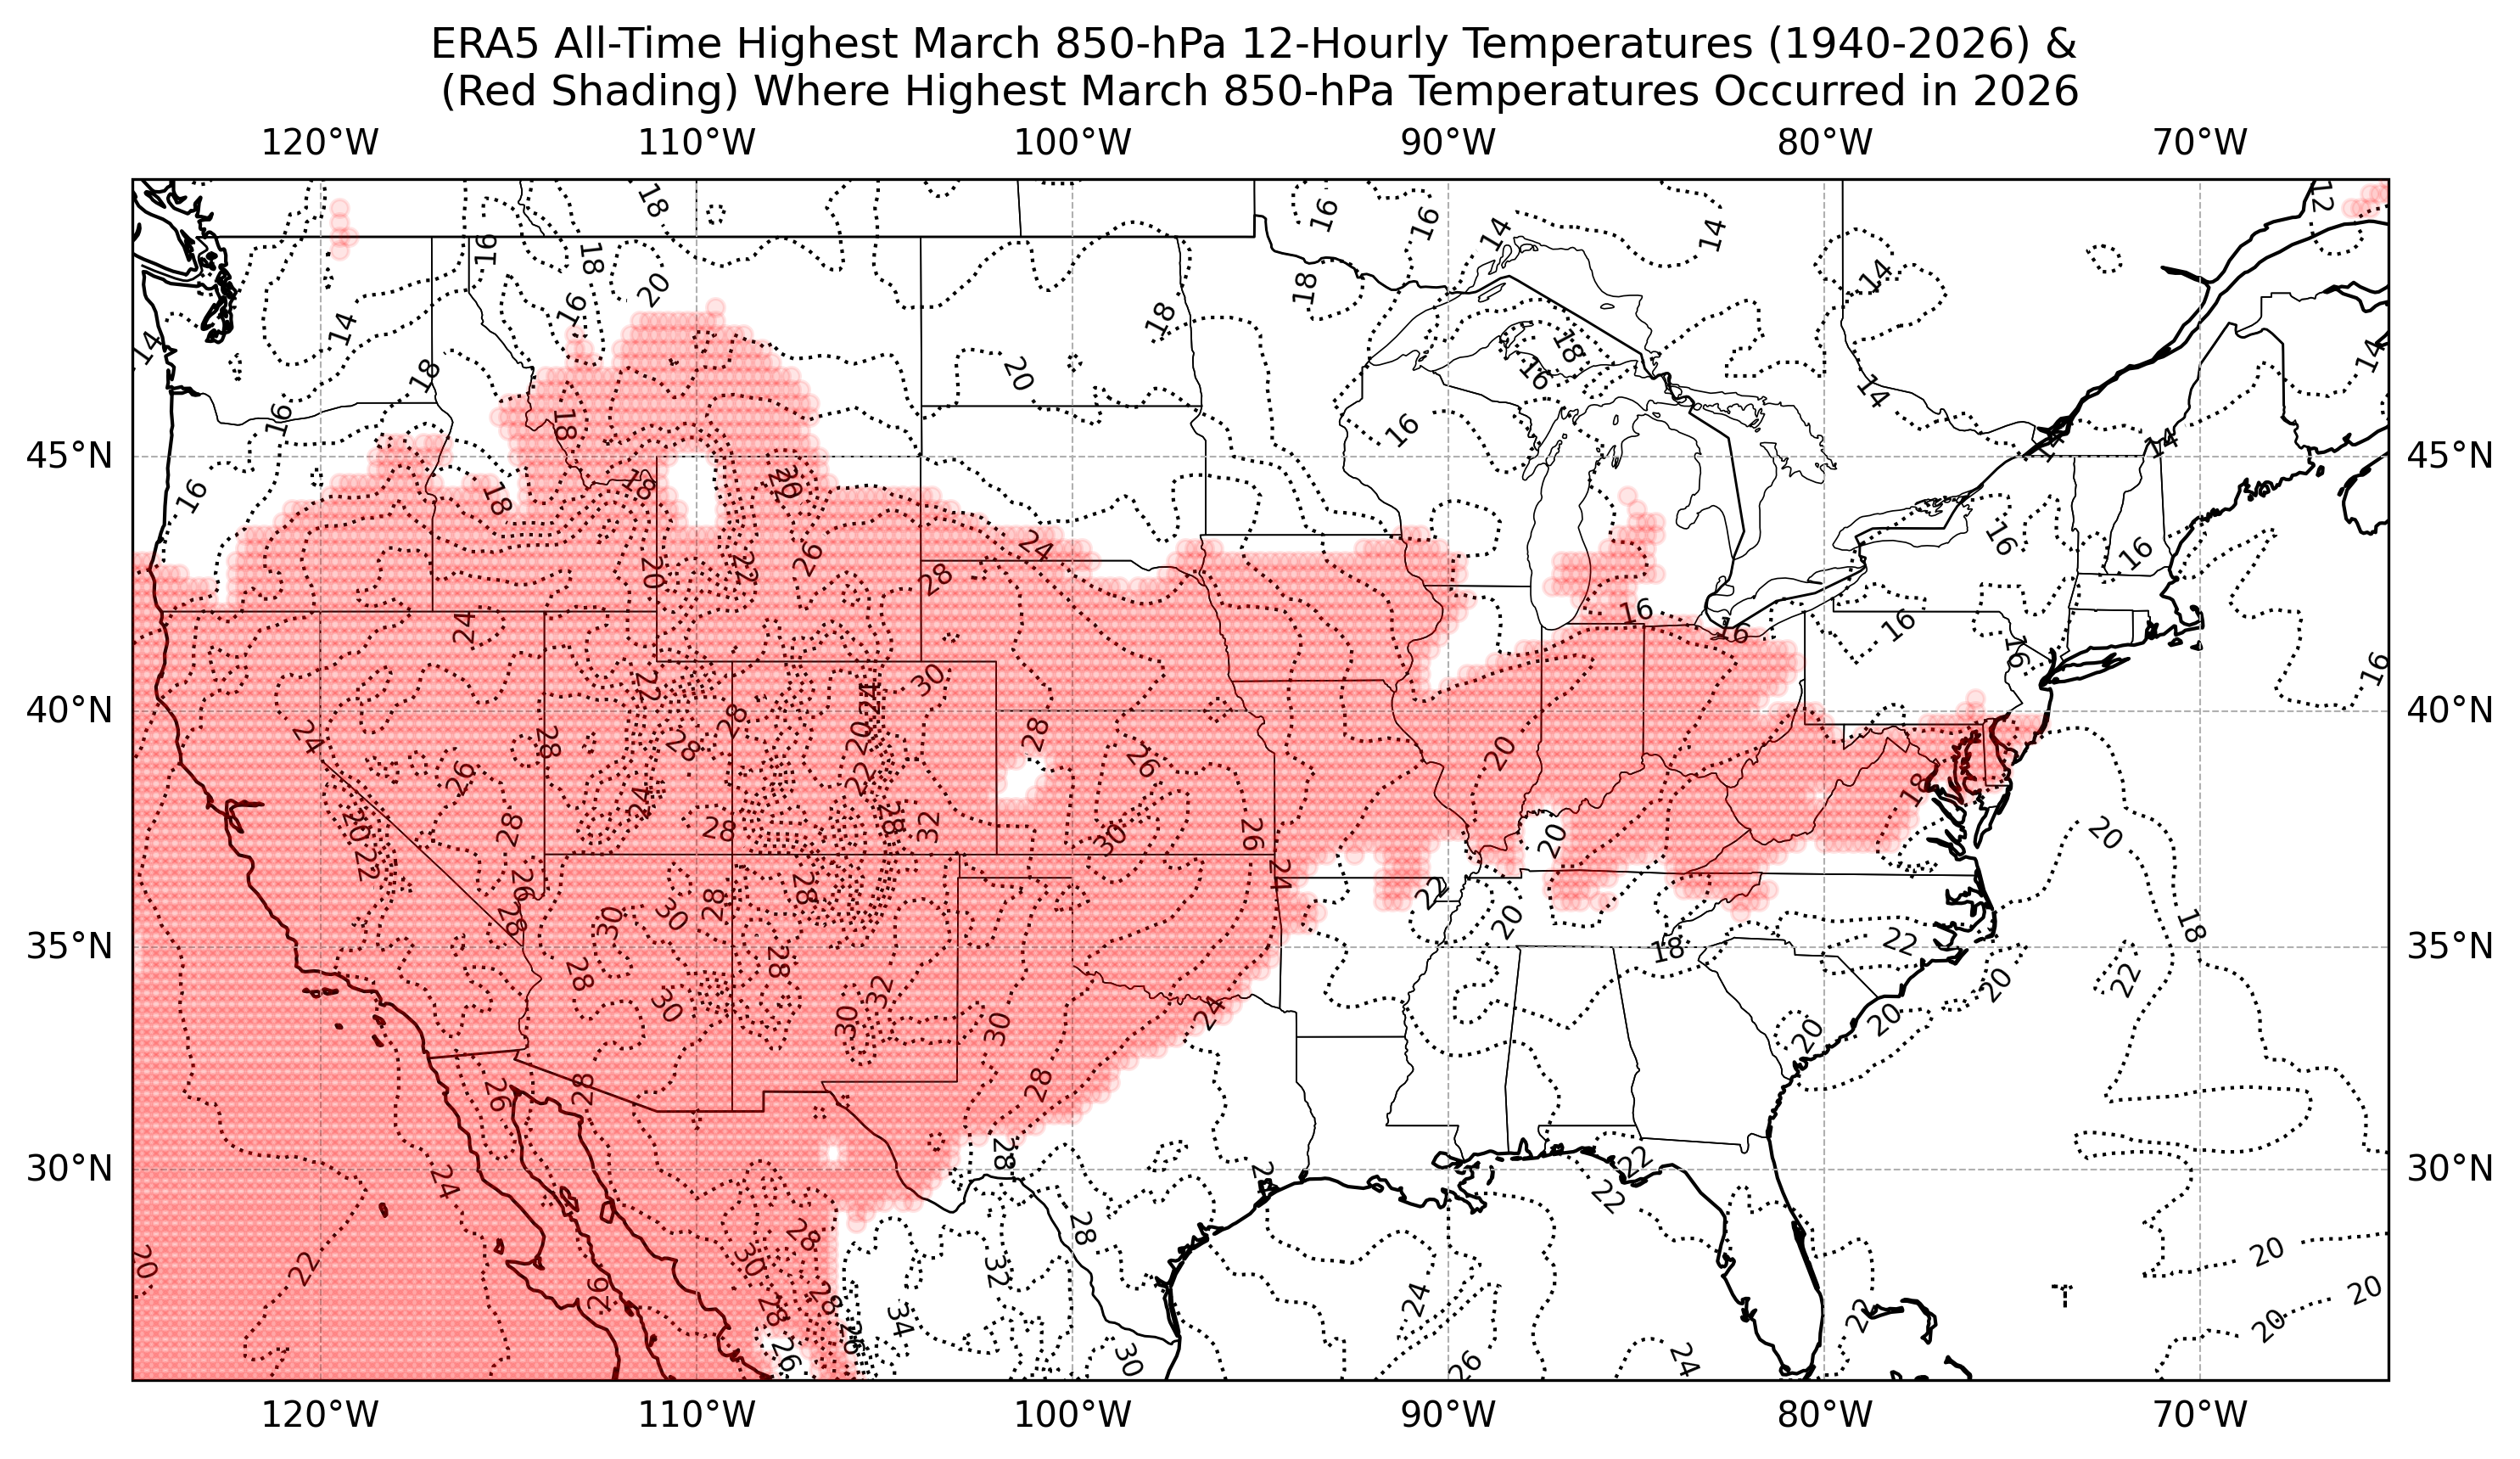
Notice the shaded areas (covering 41.7% of the map area) correspond quite well with the all-time March record high temperatures, which makes sense as the air mass at around 1450 meters will correspond well to the surface temperatures when skies are sunny and the atmosphere can be well-mixed (typical during a heat wave, though less so in other cases, like if a cold front recently moved through an area or a location is cloudy).
Let's look at another level, one less "contaminated" by the high surface in much of the western United States, the 700 hPa level (where the atmosphere is around or a little less than 70% of that at sea level, averaging around 3000 meters or 9800 feet above sea level, though usually higher in a very warm atmosphere). Here is the same map as above except for the 700 hPa temperature.
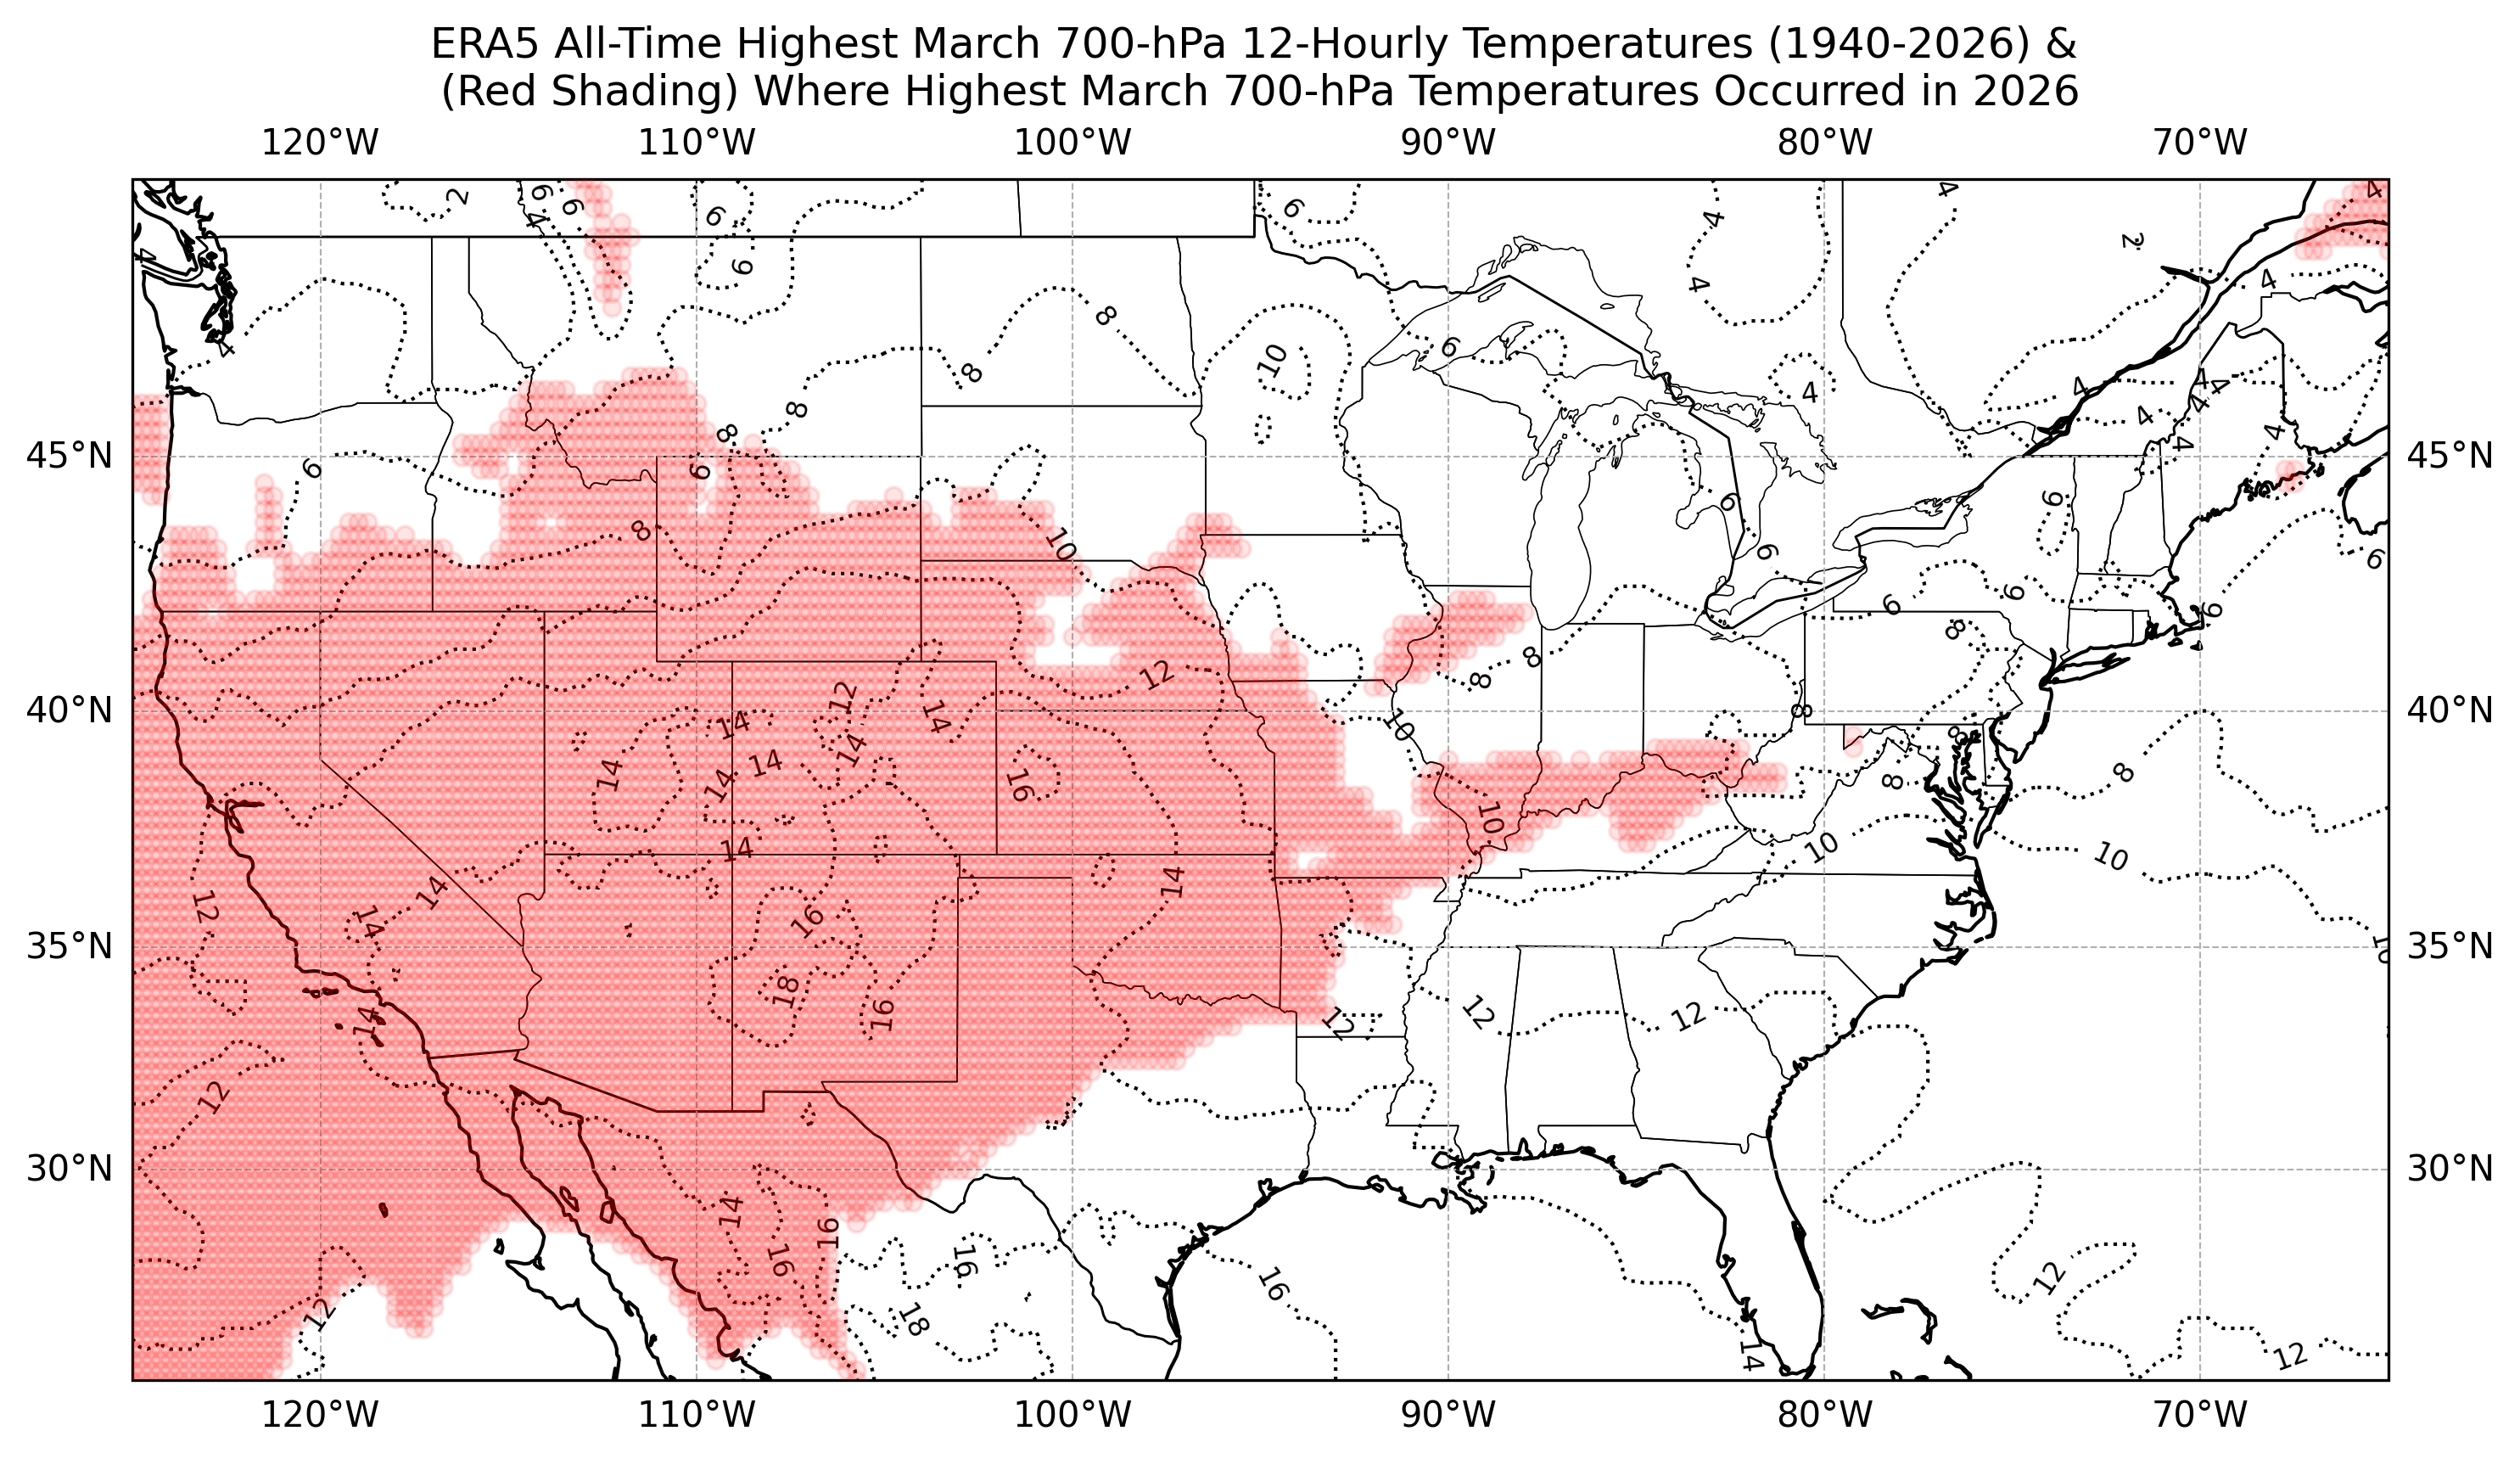
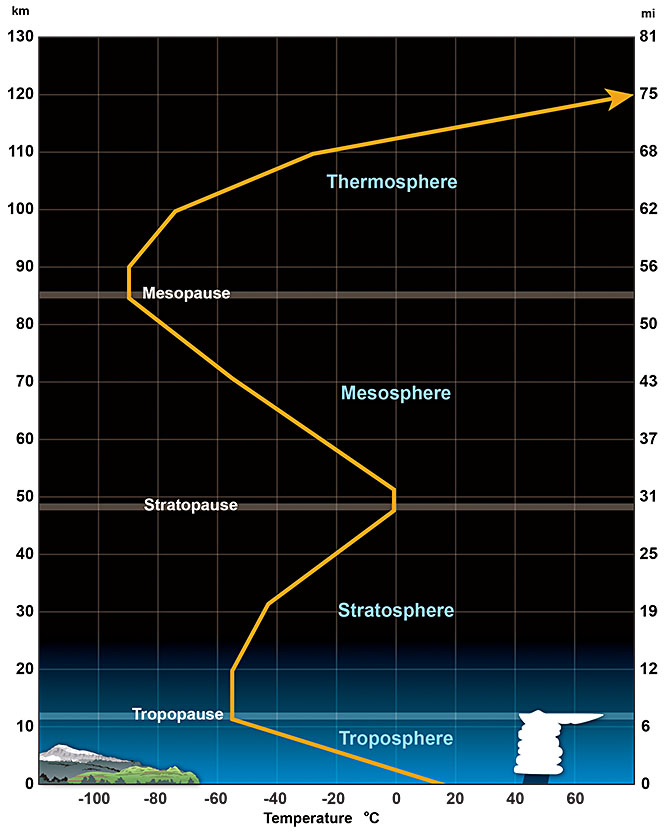
This is similar to 850 hPa but slightly less expansive (the highest 700 hPa temperatures for March that occurred in 2026 only corresponded to 34.5% of the area in the map). Generally, the higher you go in the atmosphere, the less relationship that the temperature has to the surface temperature, and once you get to the tropopause (generally 11 to 13 km above the surface (but higher in the tropics) where above that is the stratosphere where temperatures increase with height (instead of mostly decreasing below that), there is very little relationship to the surface temperature. Here is a quick review of the levels of the atmosphere (NOAA graphic), showing the levels of the atmosphere:
For a fun comparison, we will look at 500 hPa heights (the height where the pressure is above half that at sea level, such as near the top of Mt. Kilimanjaro in Tanzania, where on the uphill sections one often needs two breaths for every step taken in the hike). This is given in meters and is quite often high in a hot continental air mass. While meteorologists will be most tuned to this kind of map, other weather enthusiasts will often comprehend these heights easily as the associated contour lines of the heights easily depict where the high-pressure ridges and low-pressure troughs are.
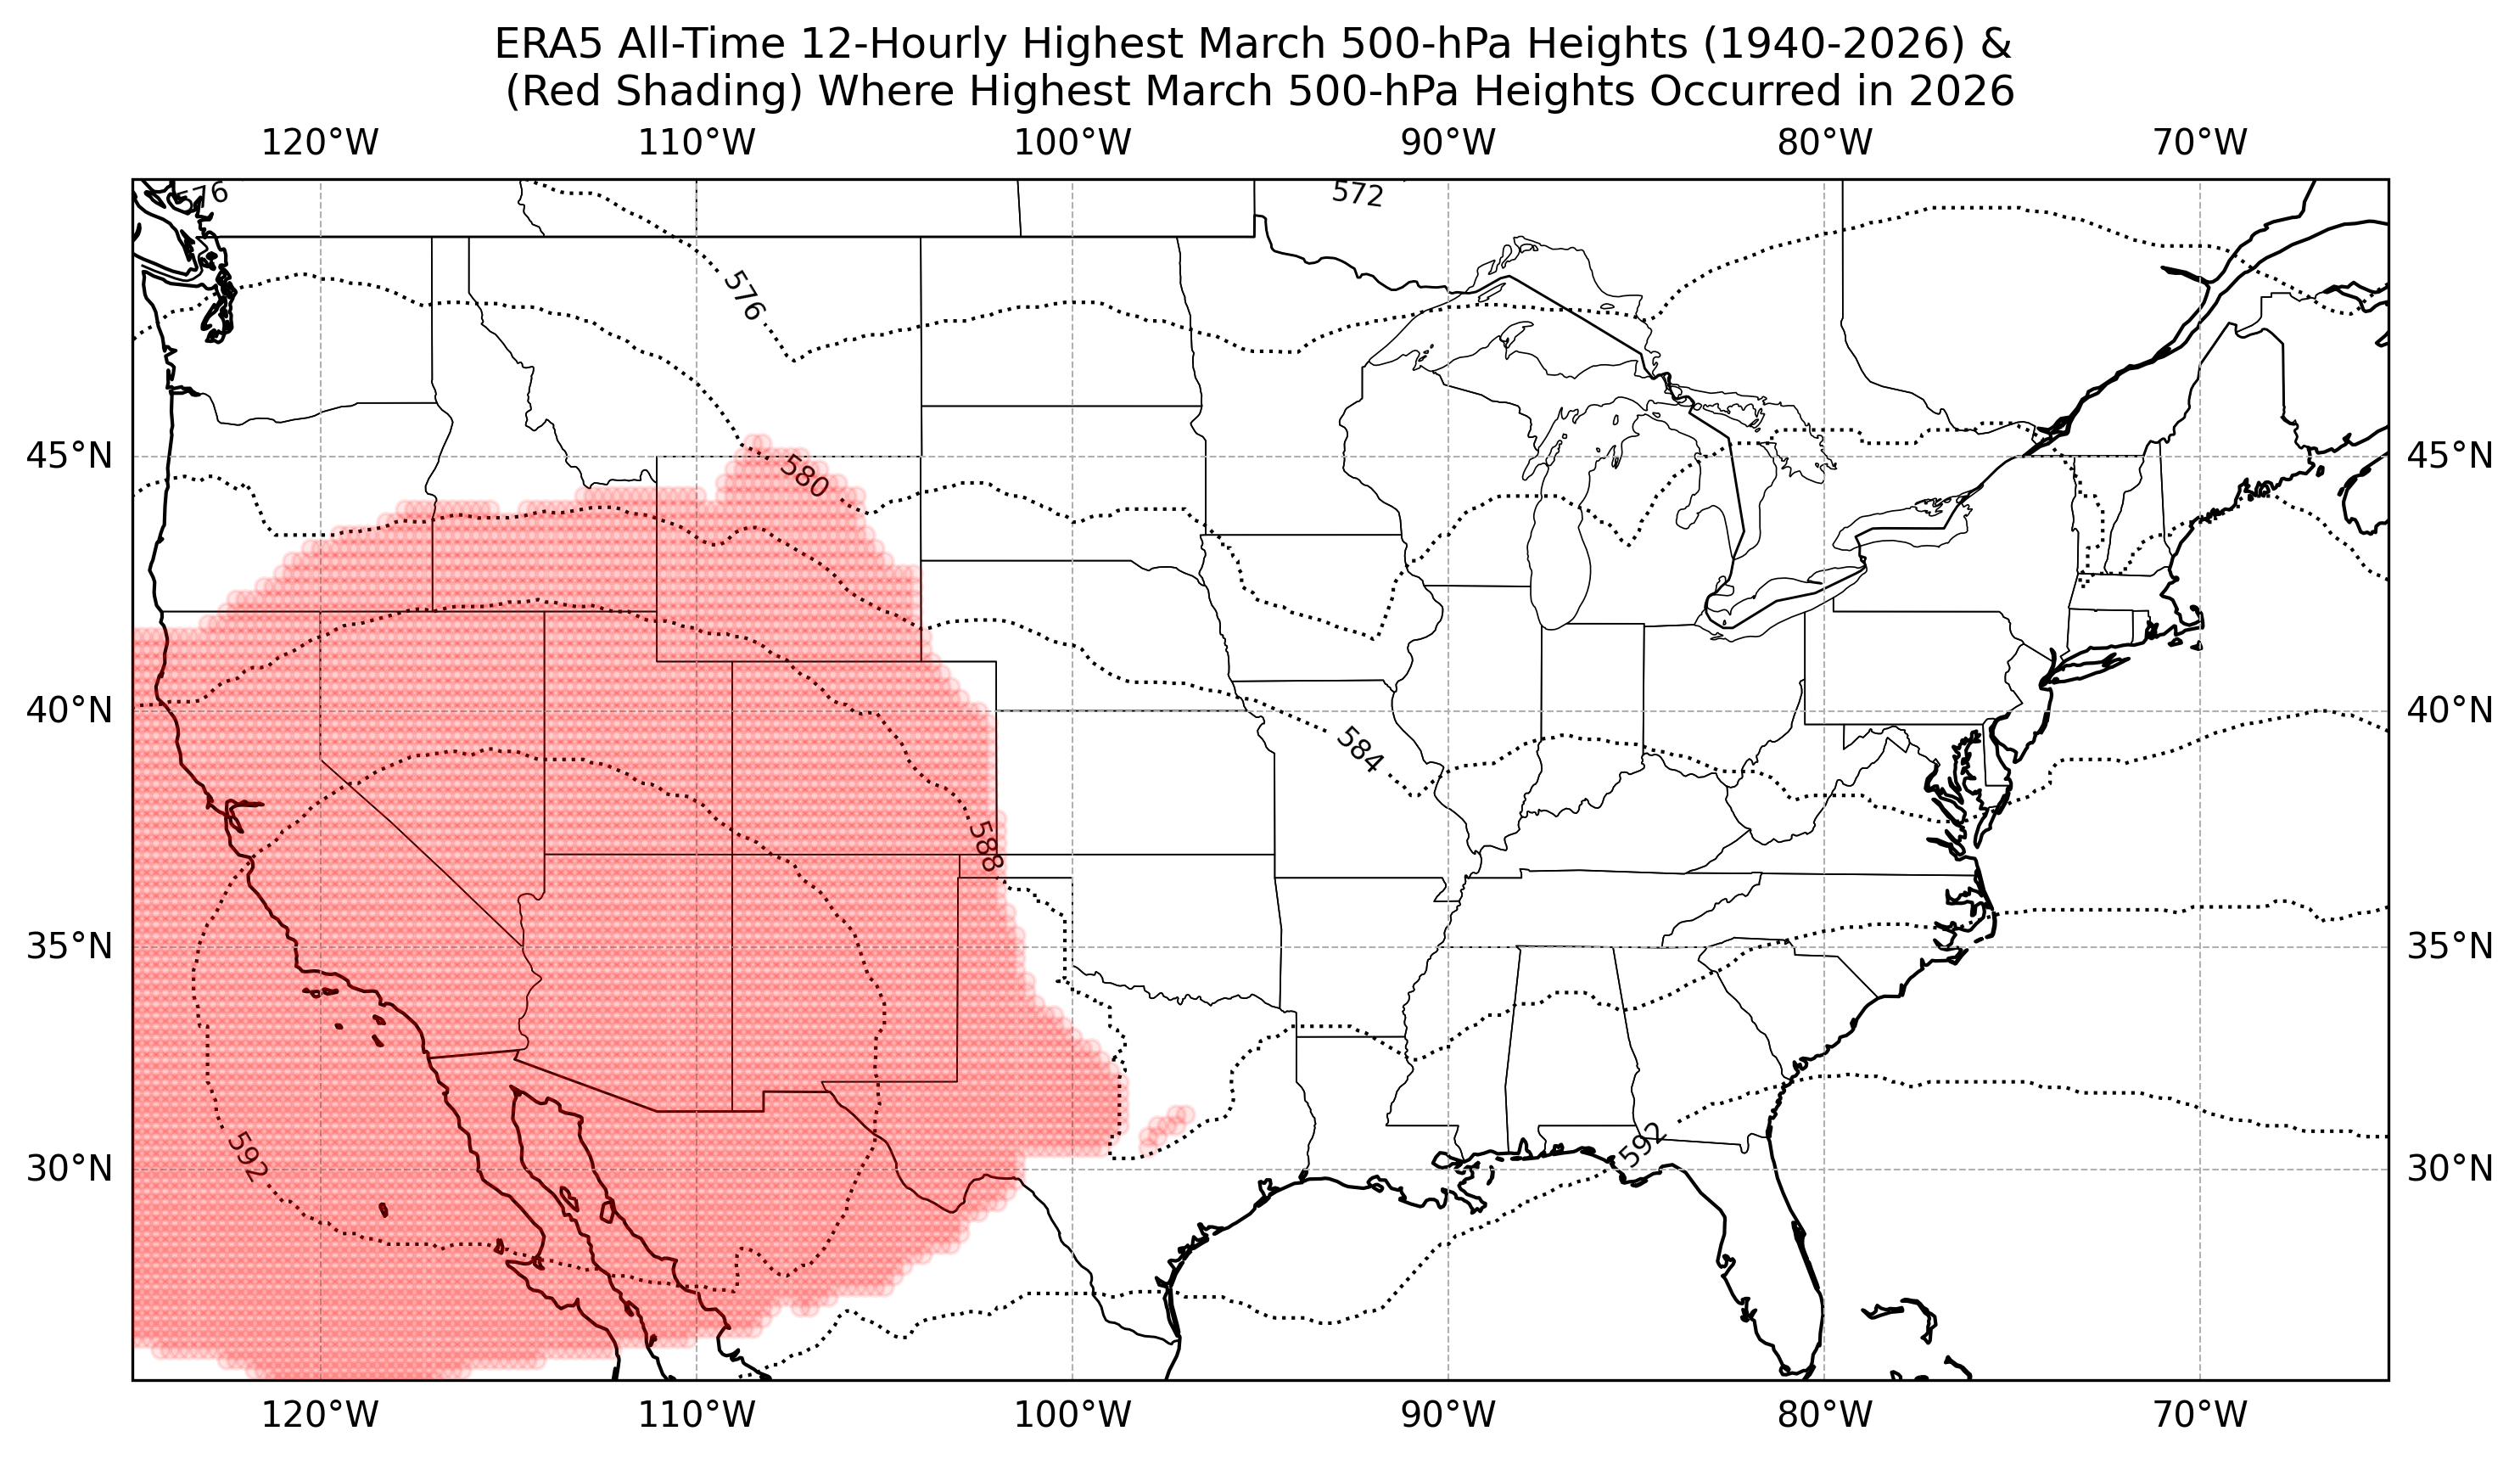
Again, the red shading notes where 2026 had the record for March. A strong ridge of high pressure was the prevailing feature in the red-shaded areas.
Next up, a similar map to the first one, except instead of showing the locations of the year the all-time highest temperature for day in March occurred, the map depicts the year of the highest monthly average temperatures for March.
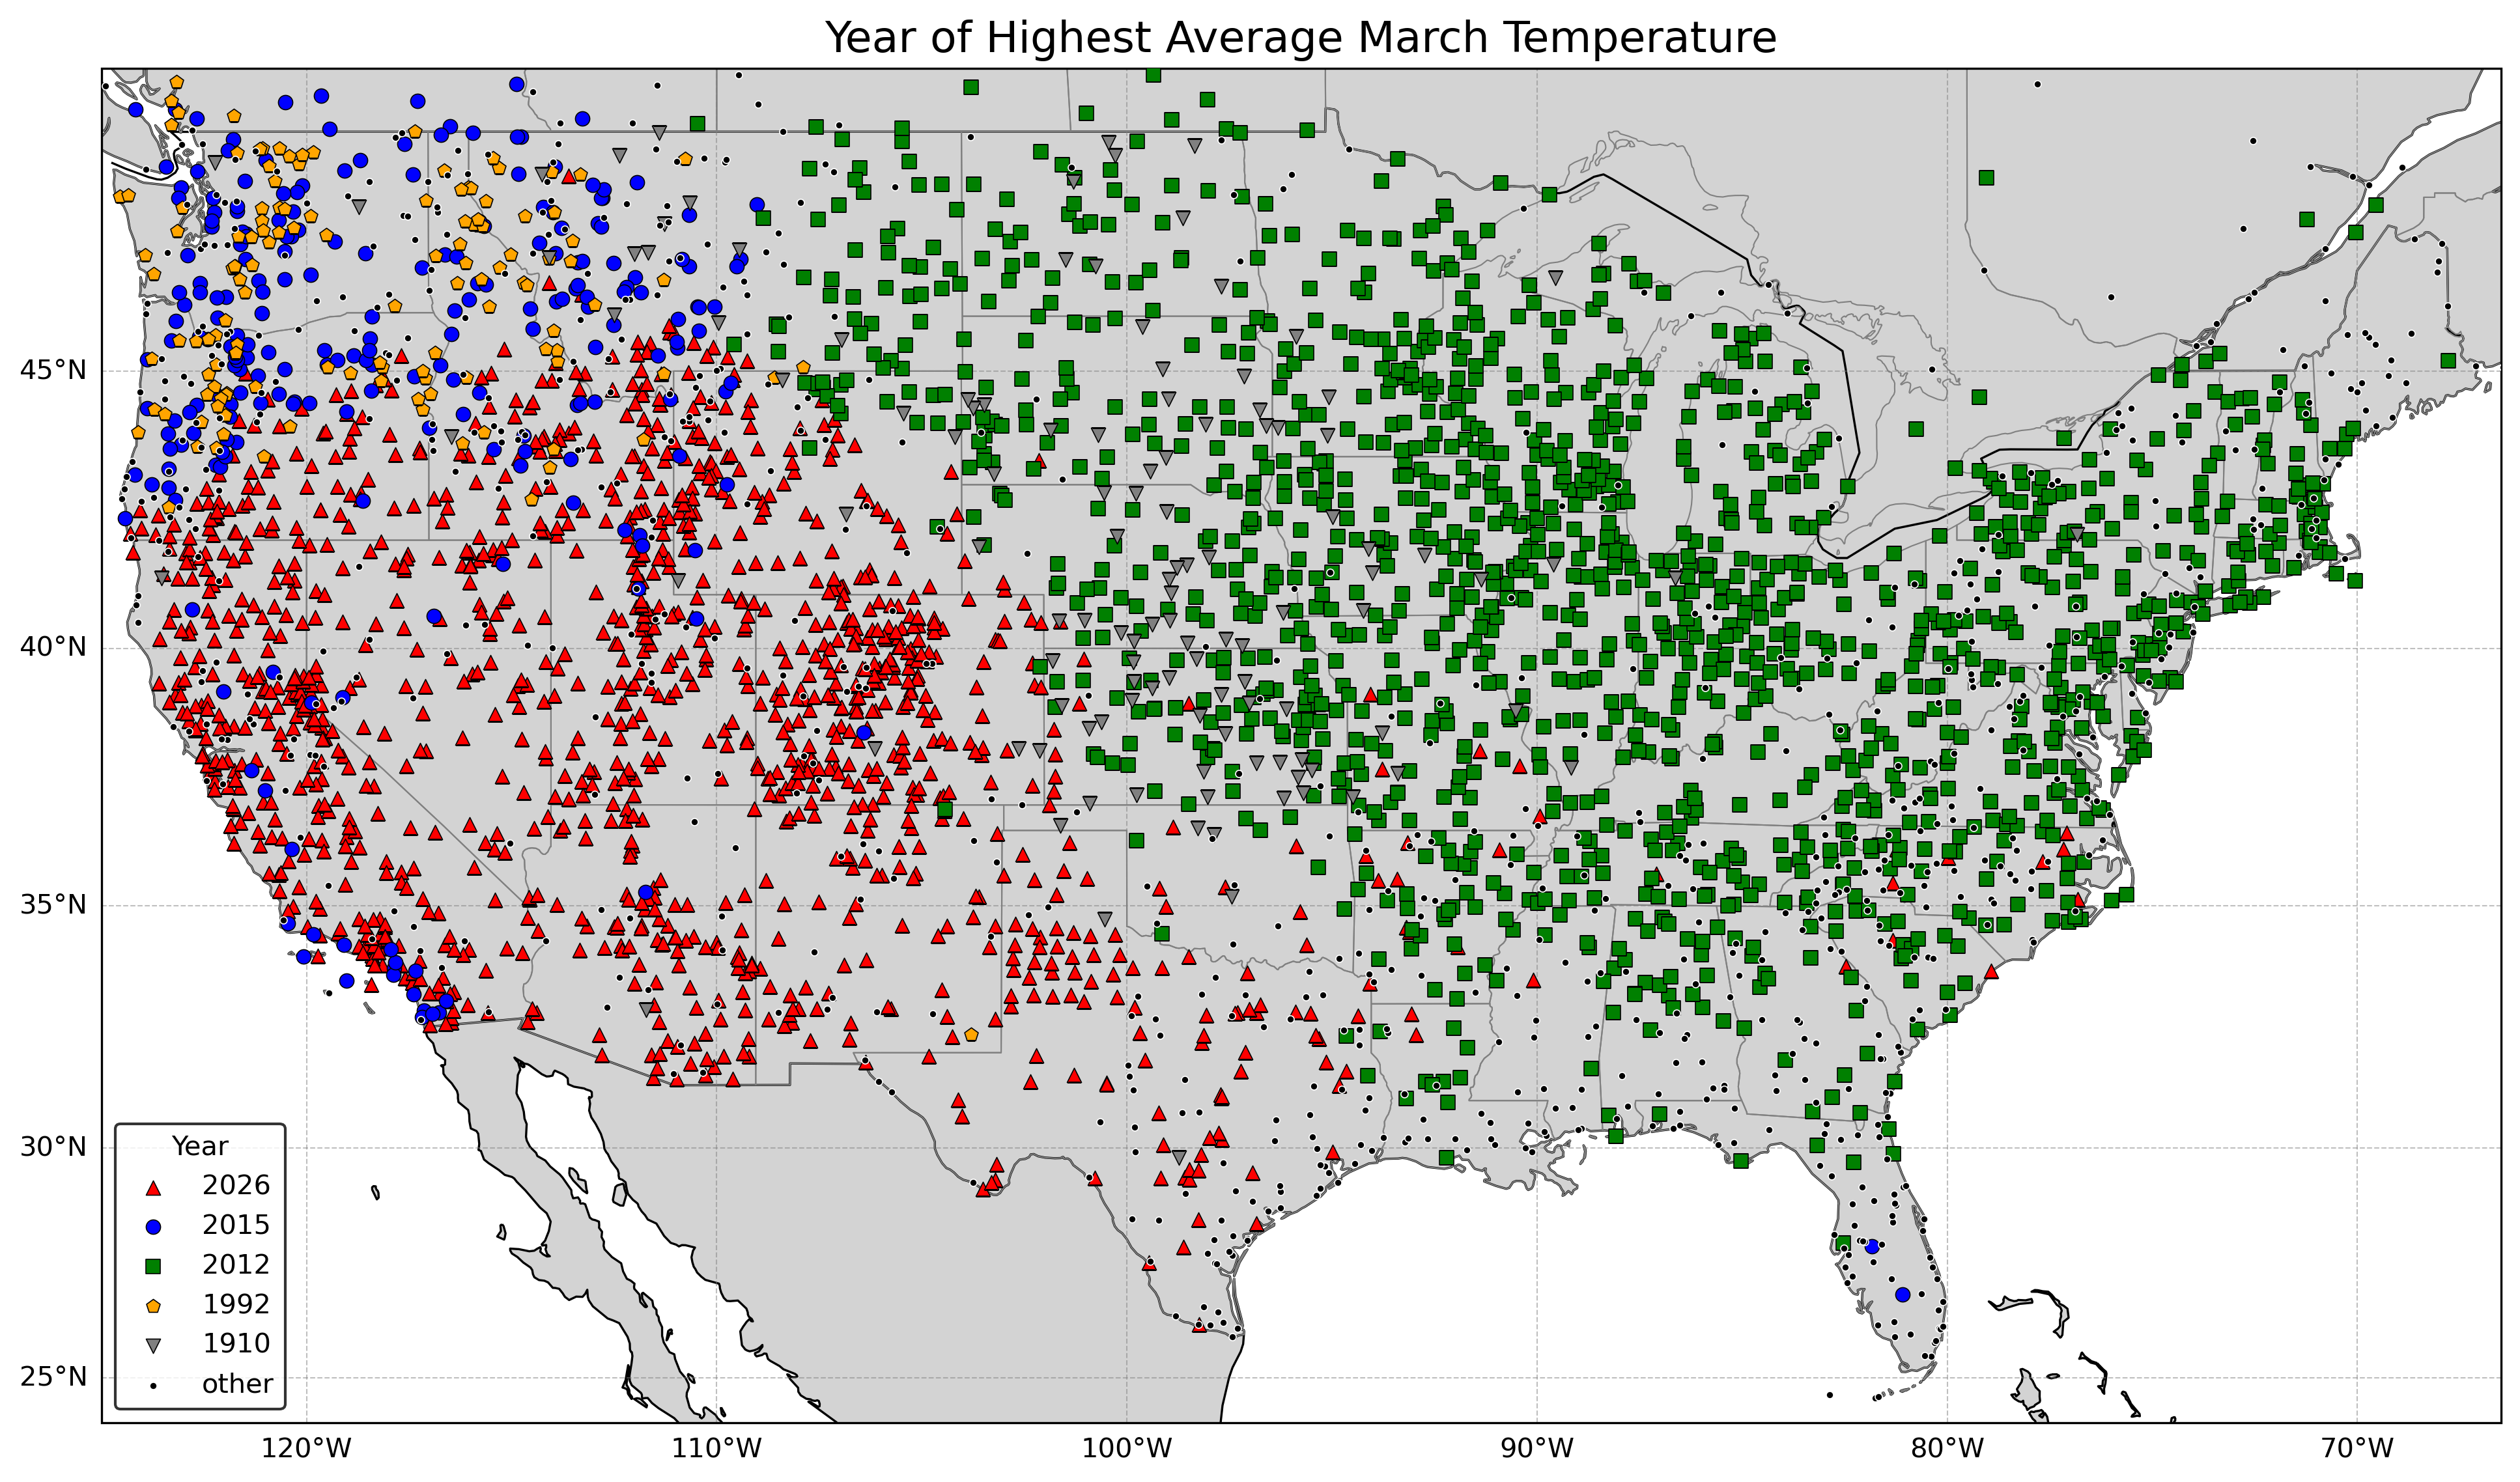
Rank       Year         Number of All-Time March
                        Average Temperatures

1.         2012                 1372
2.         2026                 1256
3.         2015                  230
4.         1992                  131
5.         1910                  120

All other years                  837
1910 shows up again as a notable extreme farther in the past. And like before, what if we just look at stations with temperature records going back to at least 1910? This is what the table would look like.
Rank       Year         Number of All-Time March
                        Average Temperatures

1.         2012                  386
2.         2026                  134
3.         1910                  114
4.         1945                   68
5.         1907                   46

All other years                  178
But what's this? There were more record high average monthly Marchs in 2012 versus 2026? Wasn't March 2026 supposed to be 0.3 C (0.5 F) warmer than March 2012 over the CONUS? March 2012 had a much different map with the hot areas generally being in the Midwest, Upper South and the Northeast (save Maine), versus the southwestern and central US in March 2026. Also, temperatures were actually below normal in the far western US in March 2012, and that covered a larger area than where temperatures below normal were in March 2026 (mainly just Washington). While the Northeast seemed cold in March 2026 (partly as a comparison to the hot areas to the Southwest), it was still overall around 3 C (5 F) above normal. The weather pattern was less consistent than in March 2012, including with cold-air intrusions interrupting the anomalous heat in the central US (for more variability since other locations would still be very anomalously warm). You can see this in the March 2026 table for Ashland, Kansas, a location which had a high of 40 C (104 F), which set the all-time record March temperature in Kansas. There were wild swings between very warm days (peaking 11 Mar 2026 at 30 C (86 F), then having low temperatures of -12 C (10 F) just a few days later, followed by 90s, followed by a couple more nights below freezing, then reaching the all-time 40 C (104 F) high on 27 Mar 2026. Obviously, there was a lot of dry air in the region with the wild swings of temperature between day or night.
But what about Alaska?
Yes, Alaska has had a cold winter, including a cold March this year, and that has made a lot of headlines in the news. Fairbanks just had its coldest March on record at 10.9 C (19.7 F) below normal, exceeding its previous record of 9.6 C (17.3 F) below normal set in 1959. Same thing with Anchorage: 6.9 C (12.4 F) below normal in March 2026, exceeding its previous record of 6.6 C (11.8 F) below normal also set in 1959. There were 46 stations with at least 30 years of temperature data (and, again, fewer than 3 missing days of data in March 2026) in Alaska with its coldest March being in 2026.
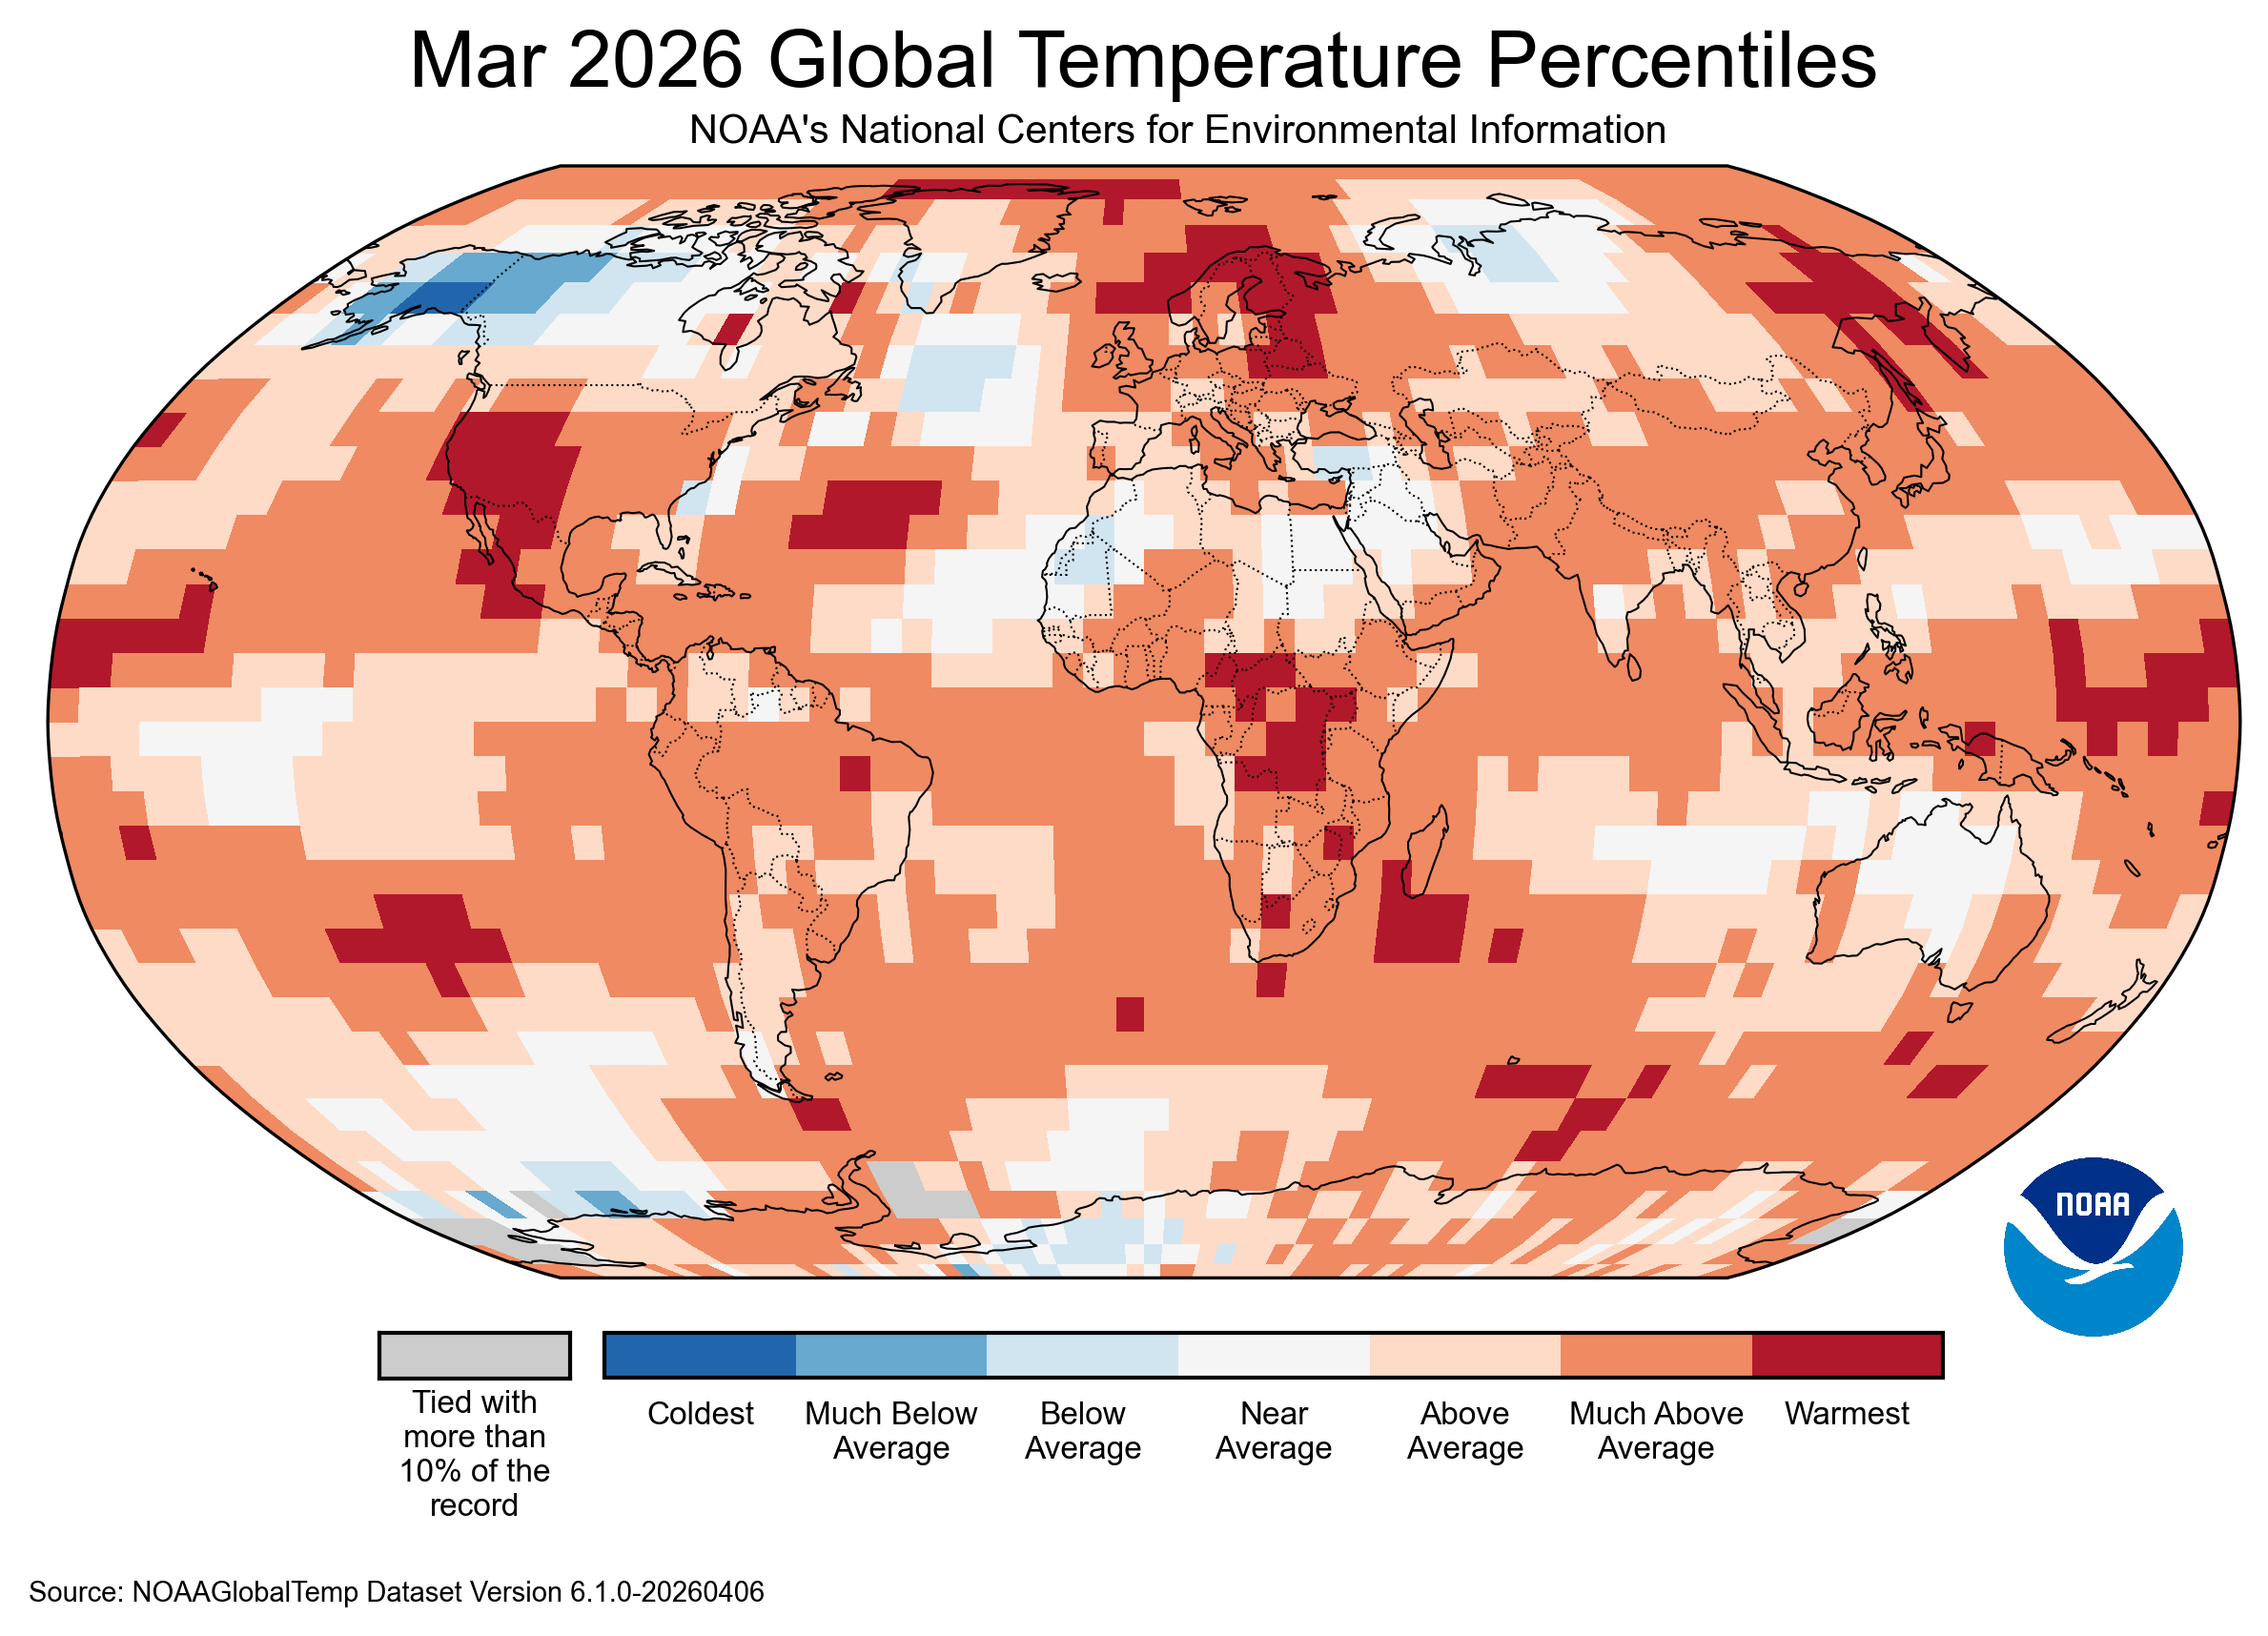
So does that negate what was going on in the CONUS in March 2026? Not really. Despite being the largest state in the US, Alaska's area of cold was still considerably smaller than the area of heat in the CONUS. In fact, NOAA published a world map showing the parts of the world that were warmer than normal in March 2026 (including all-time record warmth) versus colder than normal (including all-time record cold over a very small part of southern Alaska), and it's not even close. On top of that, 2026 had the second warmest/hottest March across the globe. From NOAA at https://www.ncei.noaa.gov/news/global-climate-202603":
Then we have the marine heat wave developing along the West Coast of the southwestern US and Mexico.
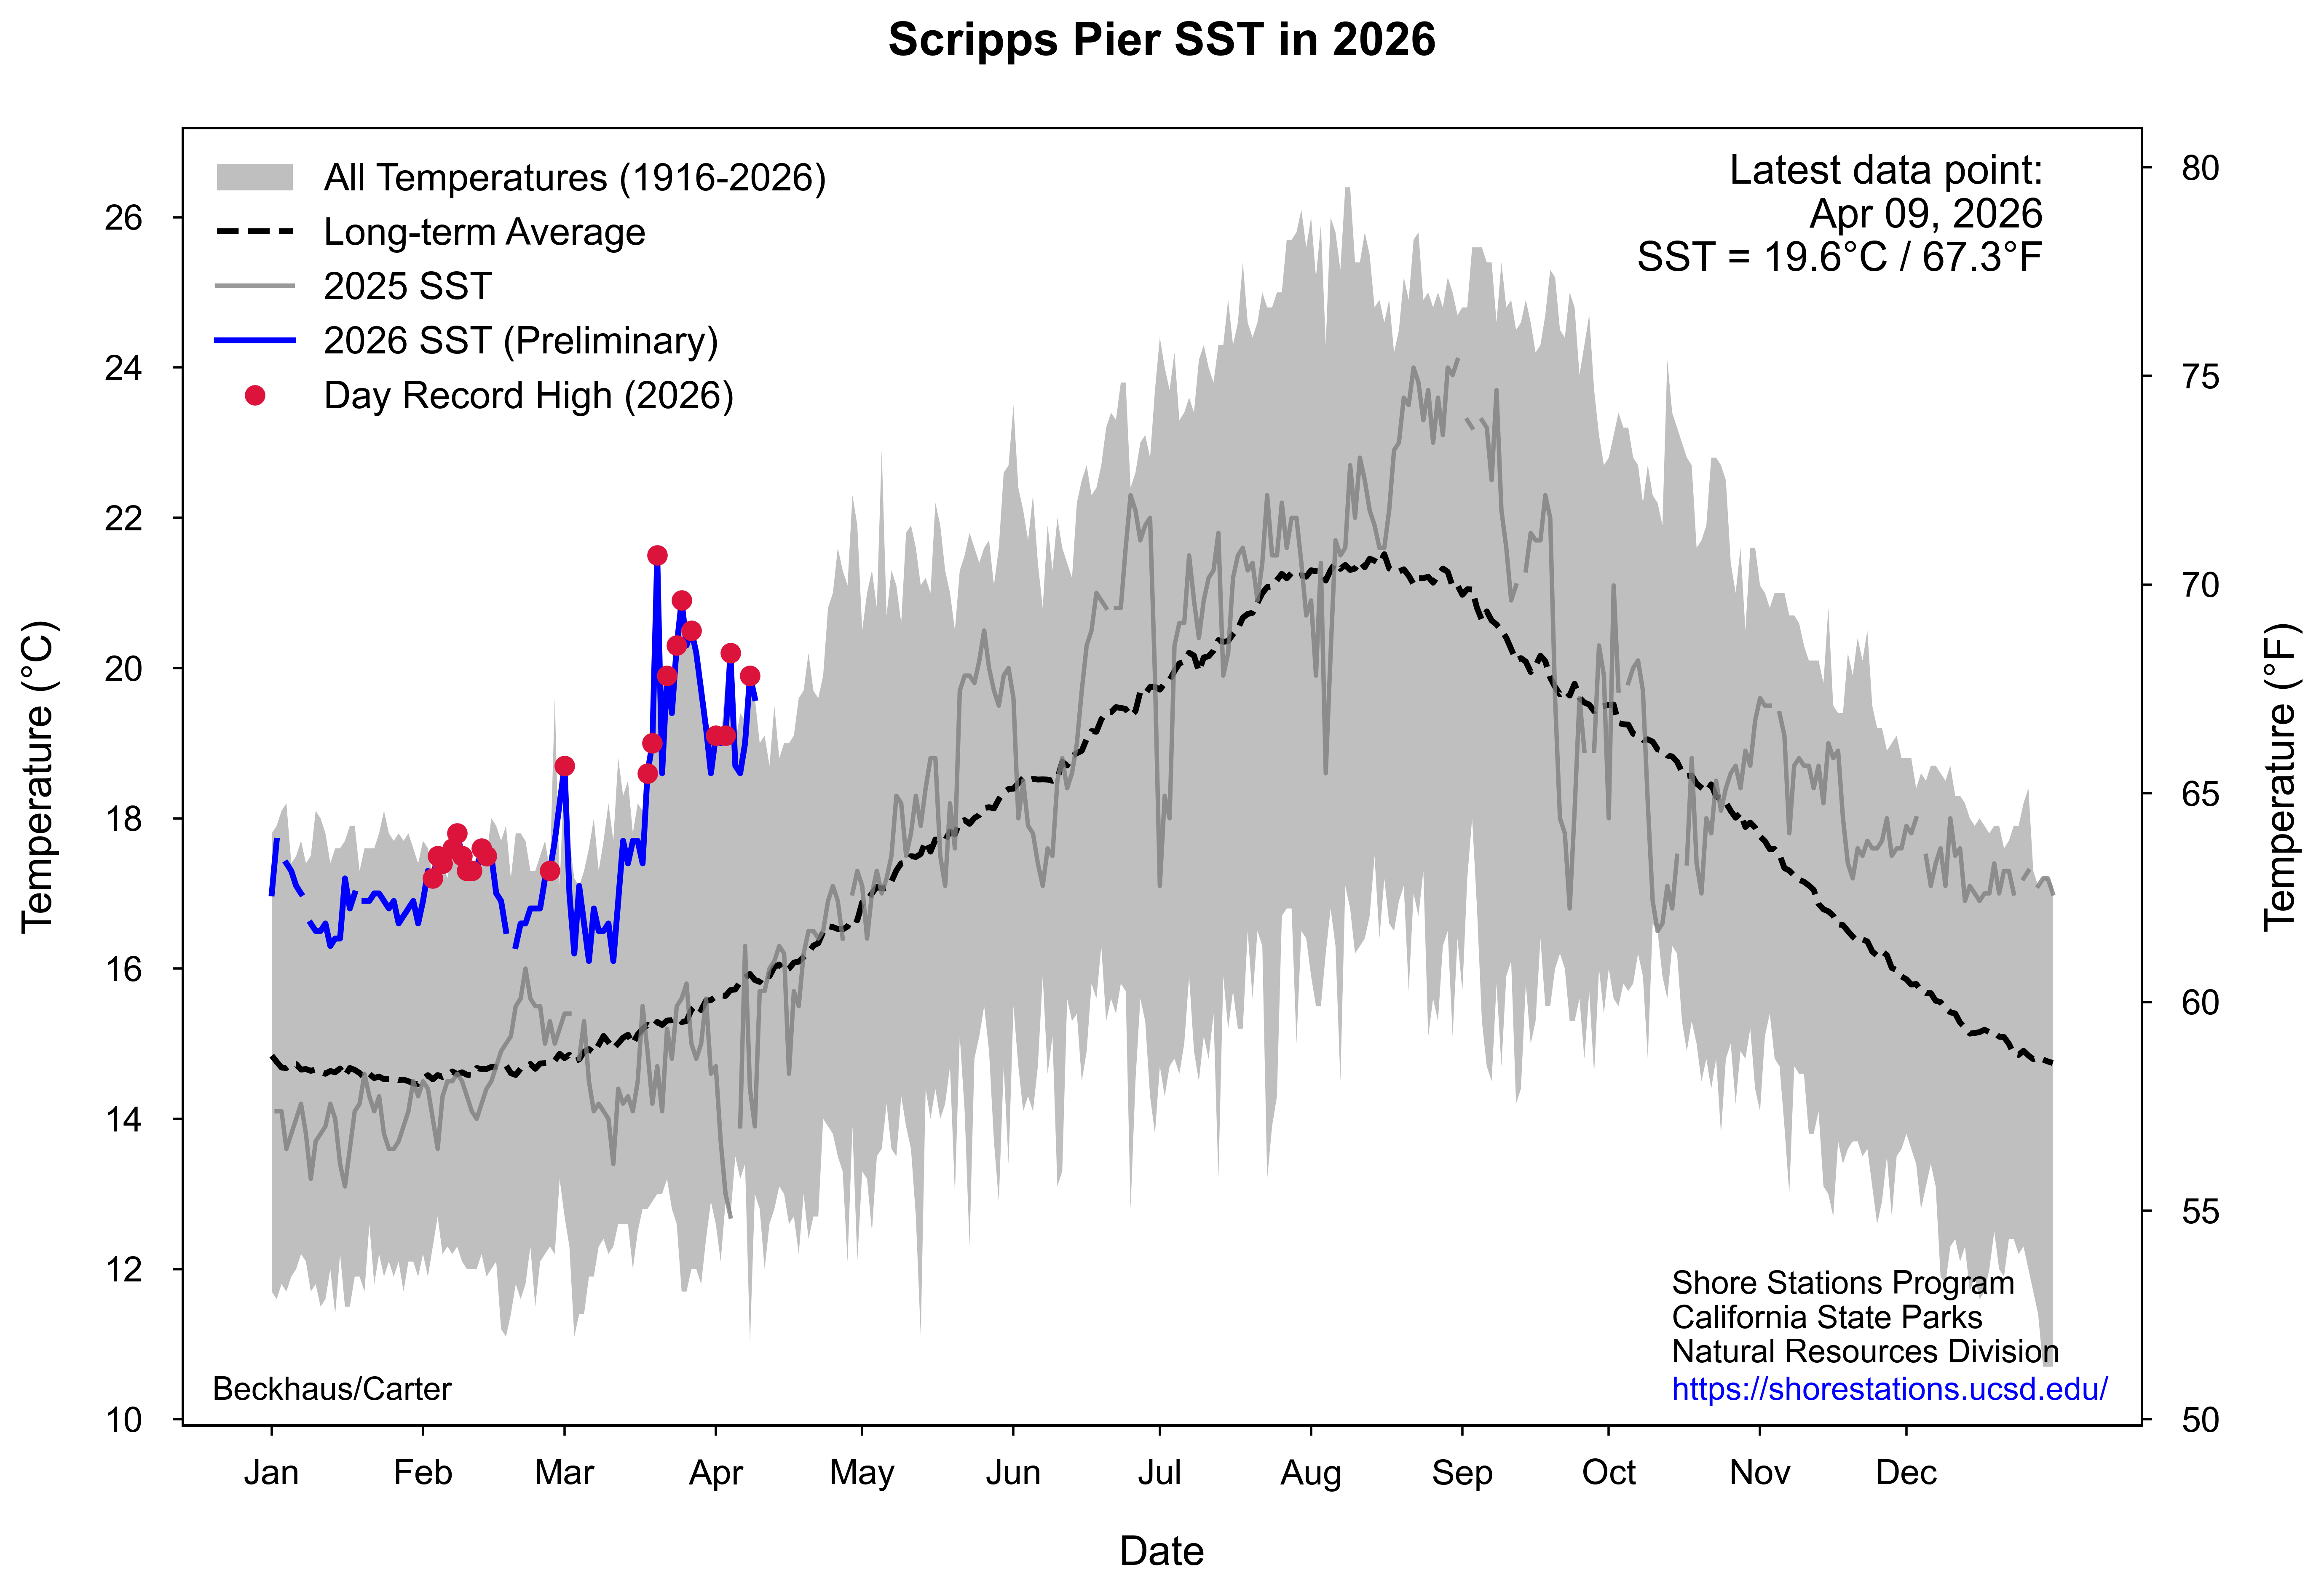
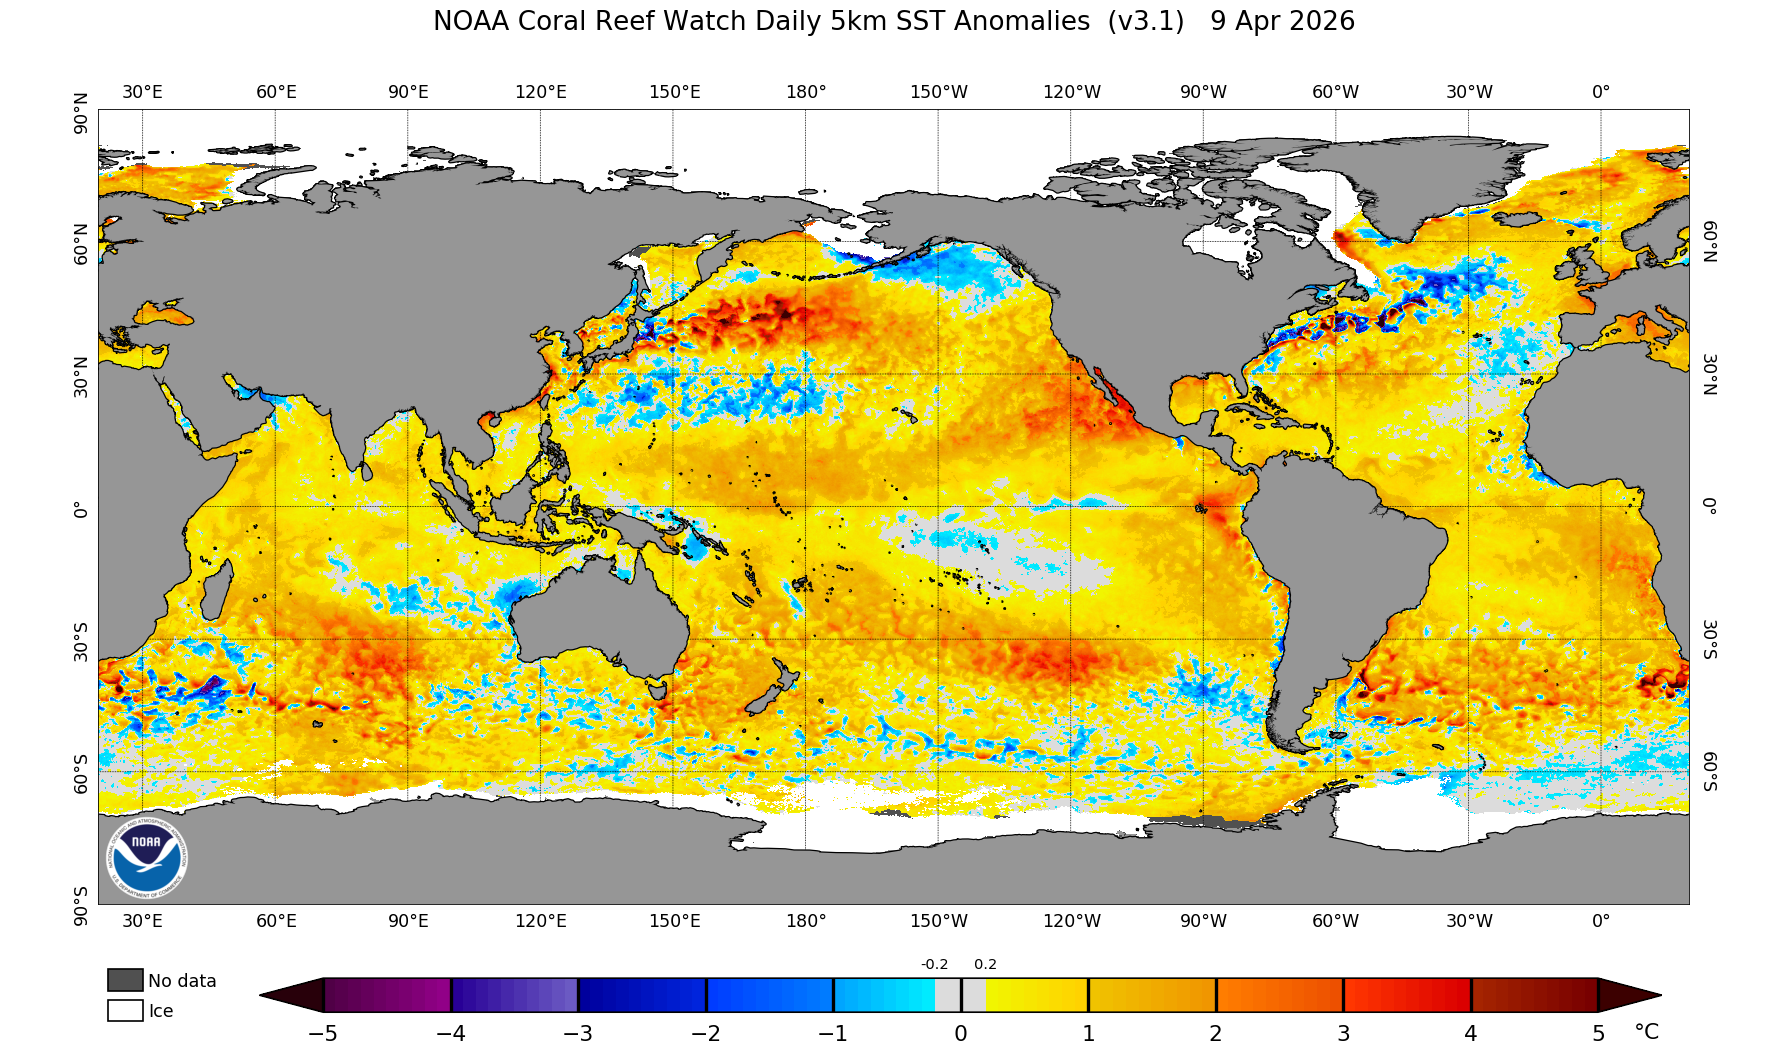 You can also see that the areas of record high 850 hPa temperatures off the southern California/Baja California coast) in the map above are in the area with water temperatures well above normal (by 2-4 C, 4-7 F), while we have a developing El Niño with a distinct possibility that it will be strong. In the "Niño 3.4" area of the Tropical Each Pacific, average sea surface temperature anomalies could be at least 1.5 C by the end of the year; of note is the very warm water developing well north off the southwestern US and Mexican Pacific coast. At Scripps Pier, a location at La Jolla (San Diego), California which has had sea surface temperature observations since 1916 (longer than any other location on the Pacific), and numerous days have had record high water temperatures for the date. This could result in very warm humid weather in southern California if this sea surface trend continues, much like in the 2014-2016 range when the northeastern Pacific had a marine heat wave.
In summary, the big picture shows record overall March heat over many parts of the world in 2026, including the western US and western Mexico. Alaska is the only substantial area in 2026 with a record cold March, and even for the next coldest category of "much below normal", only Yukon and a few parts of the coastal waters of Antarctica share any of this level with Alaska (far less than the area covered by "warmest" for the record hottest March). Overall, the maps showing anomalous heat around the world versus anomalous cold consistently show broad red shading to indicate a lot of anomalous heat, part of a well-documented long-term trend. Before we go, I should probably leave you with one last map, the one showing the actual new all-time March high temperature records set in 2026 (hard to read, even if you click to zoom in, because there are simply so many!).
Come back soon for analyses of weather and climate, anywhere from California to other parts of the US to around the world!
Some of the future topics will include:
The wettest atmospheres in the world (based on "precipitable water")
Timberlines (highest elevation that trees can grow in a mountain range) and climate
Maximum precipitation rates reported given a certain temperature
Ways for anyone to get "strange" climate data online
Case studies of unusual storms