
Periodic analyses of weather and climate will be posted here, with links to previous editions at the bottom. Remember to click on the image if you need to zoom in.
If one were to ask which tornado in the world has caused the greatest number of deaths, many would assume that would be one from the United States. According to the National Centers for Environment Information at https://www.ncei.noaa.gov/access/monitoring/tornadoes/deadliest, the deadliest tornado in the US was the Tri-State tornado (Missouri, Illinois, Indiana) on 18 Mar 1925 with 695 deaths. This is not surprising as it had the longest path ever recorded of any tornado at a length of 352 km (219 miles), though with some question as to how continuous the path was (mainly near the beginning and end).
But the Tri-State Tornado is not #1 worldwide. A tornado in central Bangladesh, the Daulatpur–Saturia tornado, had an estimated 1300 deaths (World Meteorological Organization), nearly twice what the Tri-State tornado had (though note that storm death estimates are much more difficult to achieve in the Global South than in countries with higher living standards; Cyclone Nargis (2008) in nearby Myanmar had an official death toll of around 138,000, but some believe the actual toll was more than double). Should this high death toll in Myanmar be a surprise? Not really, as this was a mile-wide (1.6 km) tornado with an 80-km (50 mile) path in a country with one of the highest population densities in the world (in 1989 there were almost 105 million people in an area slightly smaller than the US state of Georgia) with (at least then) limited resources for tornado warnings. And Bangladesh gets a lot of severe weather, both from tropical cyclones moving north from the Bay of Bengal and from spring thunderstorms which produce around 6 tornadoes per year (but variable year-to-year, much like in the US) and also large hail during spring. We will look at why, with the big focus on the 1989 tornado. Our primary tool will be the ERA5 reanalysis (related to the ECMWF model) which has a horizontal resolution of 0.25° Latitude and Longitude (about 25 km) as well as 37 vertical levels. While less data were available in 1989 versus today, the combination of primarily satellite data, weather balloons (radiosondes), and surface observations (both over land and sea), plus the use of "4D analysis" which makes good use of timing of different data, can still give us a reasonably accurate snapshot of weather events then. The reanalysis data that we will view will be for 1200 UTC or 6 PM Bangladesh Standard Time (26 Apr 1989), since the tornado touched down about one-half hour later.
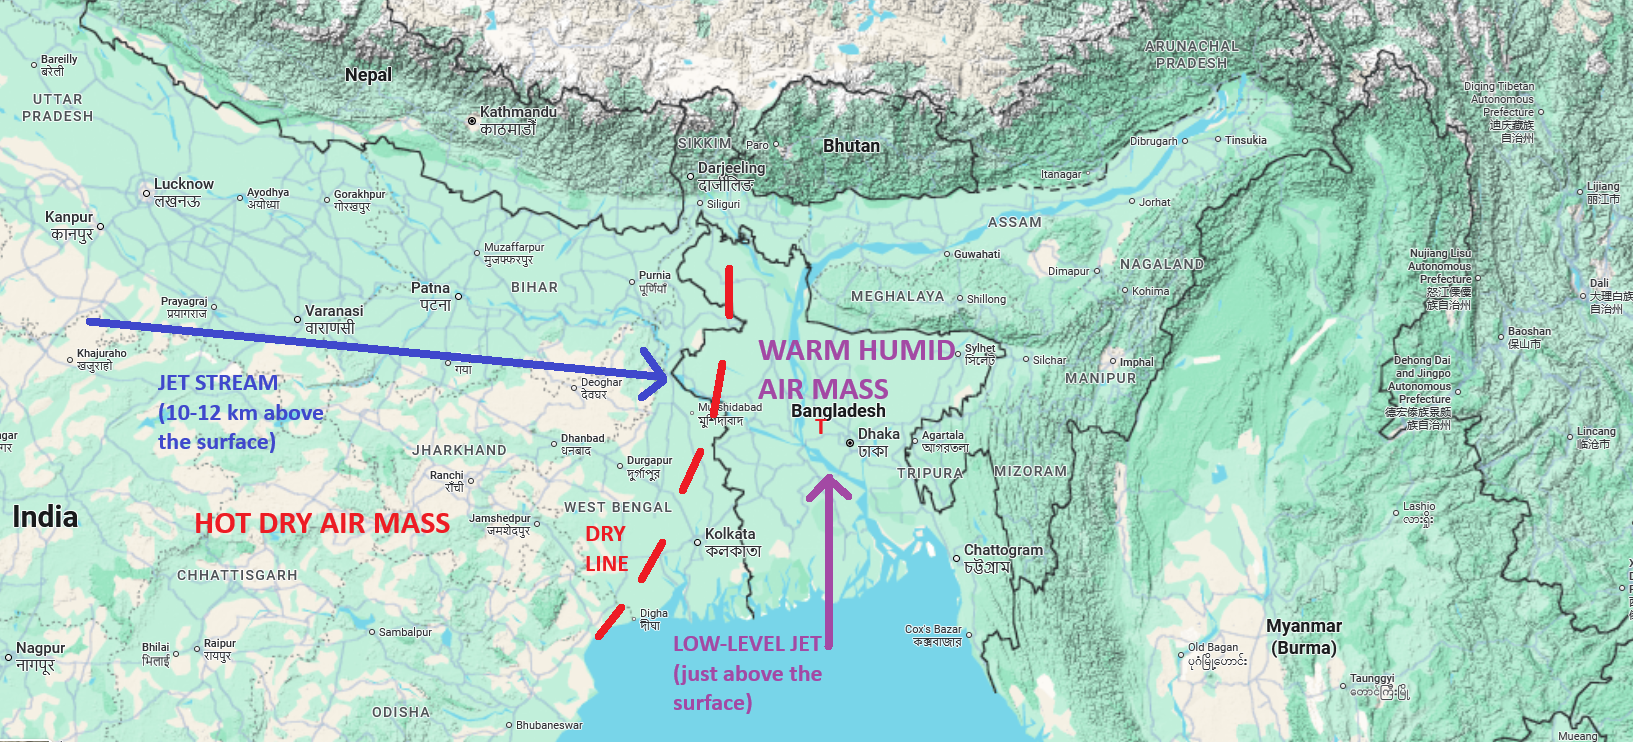
Let's look at the big picture during tornado events in Bangladesh via the map above, with 26 Apr 1989 tornado location noted by the small T in central Bangladesh (very close to Latitude 24°N, Longitude 90°E (most of the images below have the latitude and longitude lines for these values). A jet stream crosses northern India from west to east, with its positioning greatly affected by the Himalayas to the north and Tibet beyond that which act to block a lot of the air flow which forces the westerly winds aloft farther south over northern India. During the spring, India heats up greatly and becomes quite hot, with temperatures exceeding 43 C/110 F at times, aided by the dry conditions during winter and spring. The Bay of Bengal sits to the south of Bangladesh, and typically when low pressure forms or moves in from the west, a low-level jet can develop (usually in the lowest 1-2 km above the surface) which brings very moist air north into Bangladesh from the Bay of Bengal (which has unusually high sea surface (water) temperatures for its latitude, usually exceeding 28 C/82 F in April, with parts of the bay exceeding 30 C/86 F). But this south-to-north low-level jet does not just contribute to severe weather by bringing in great amounts of moisture but also results in strong directional wind shear, with the south flow near the surface contrasting with the westerly flow from the incoming jet stream. We can see this in a simulated sounding for the location of the tornado, using that ERA5 reanalysis data from about 30 minutes before the tornado touchdown.
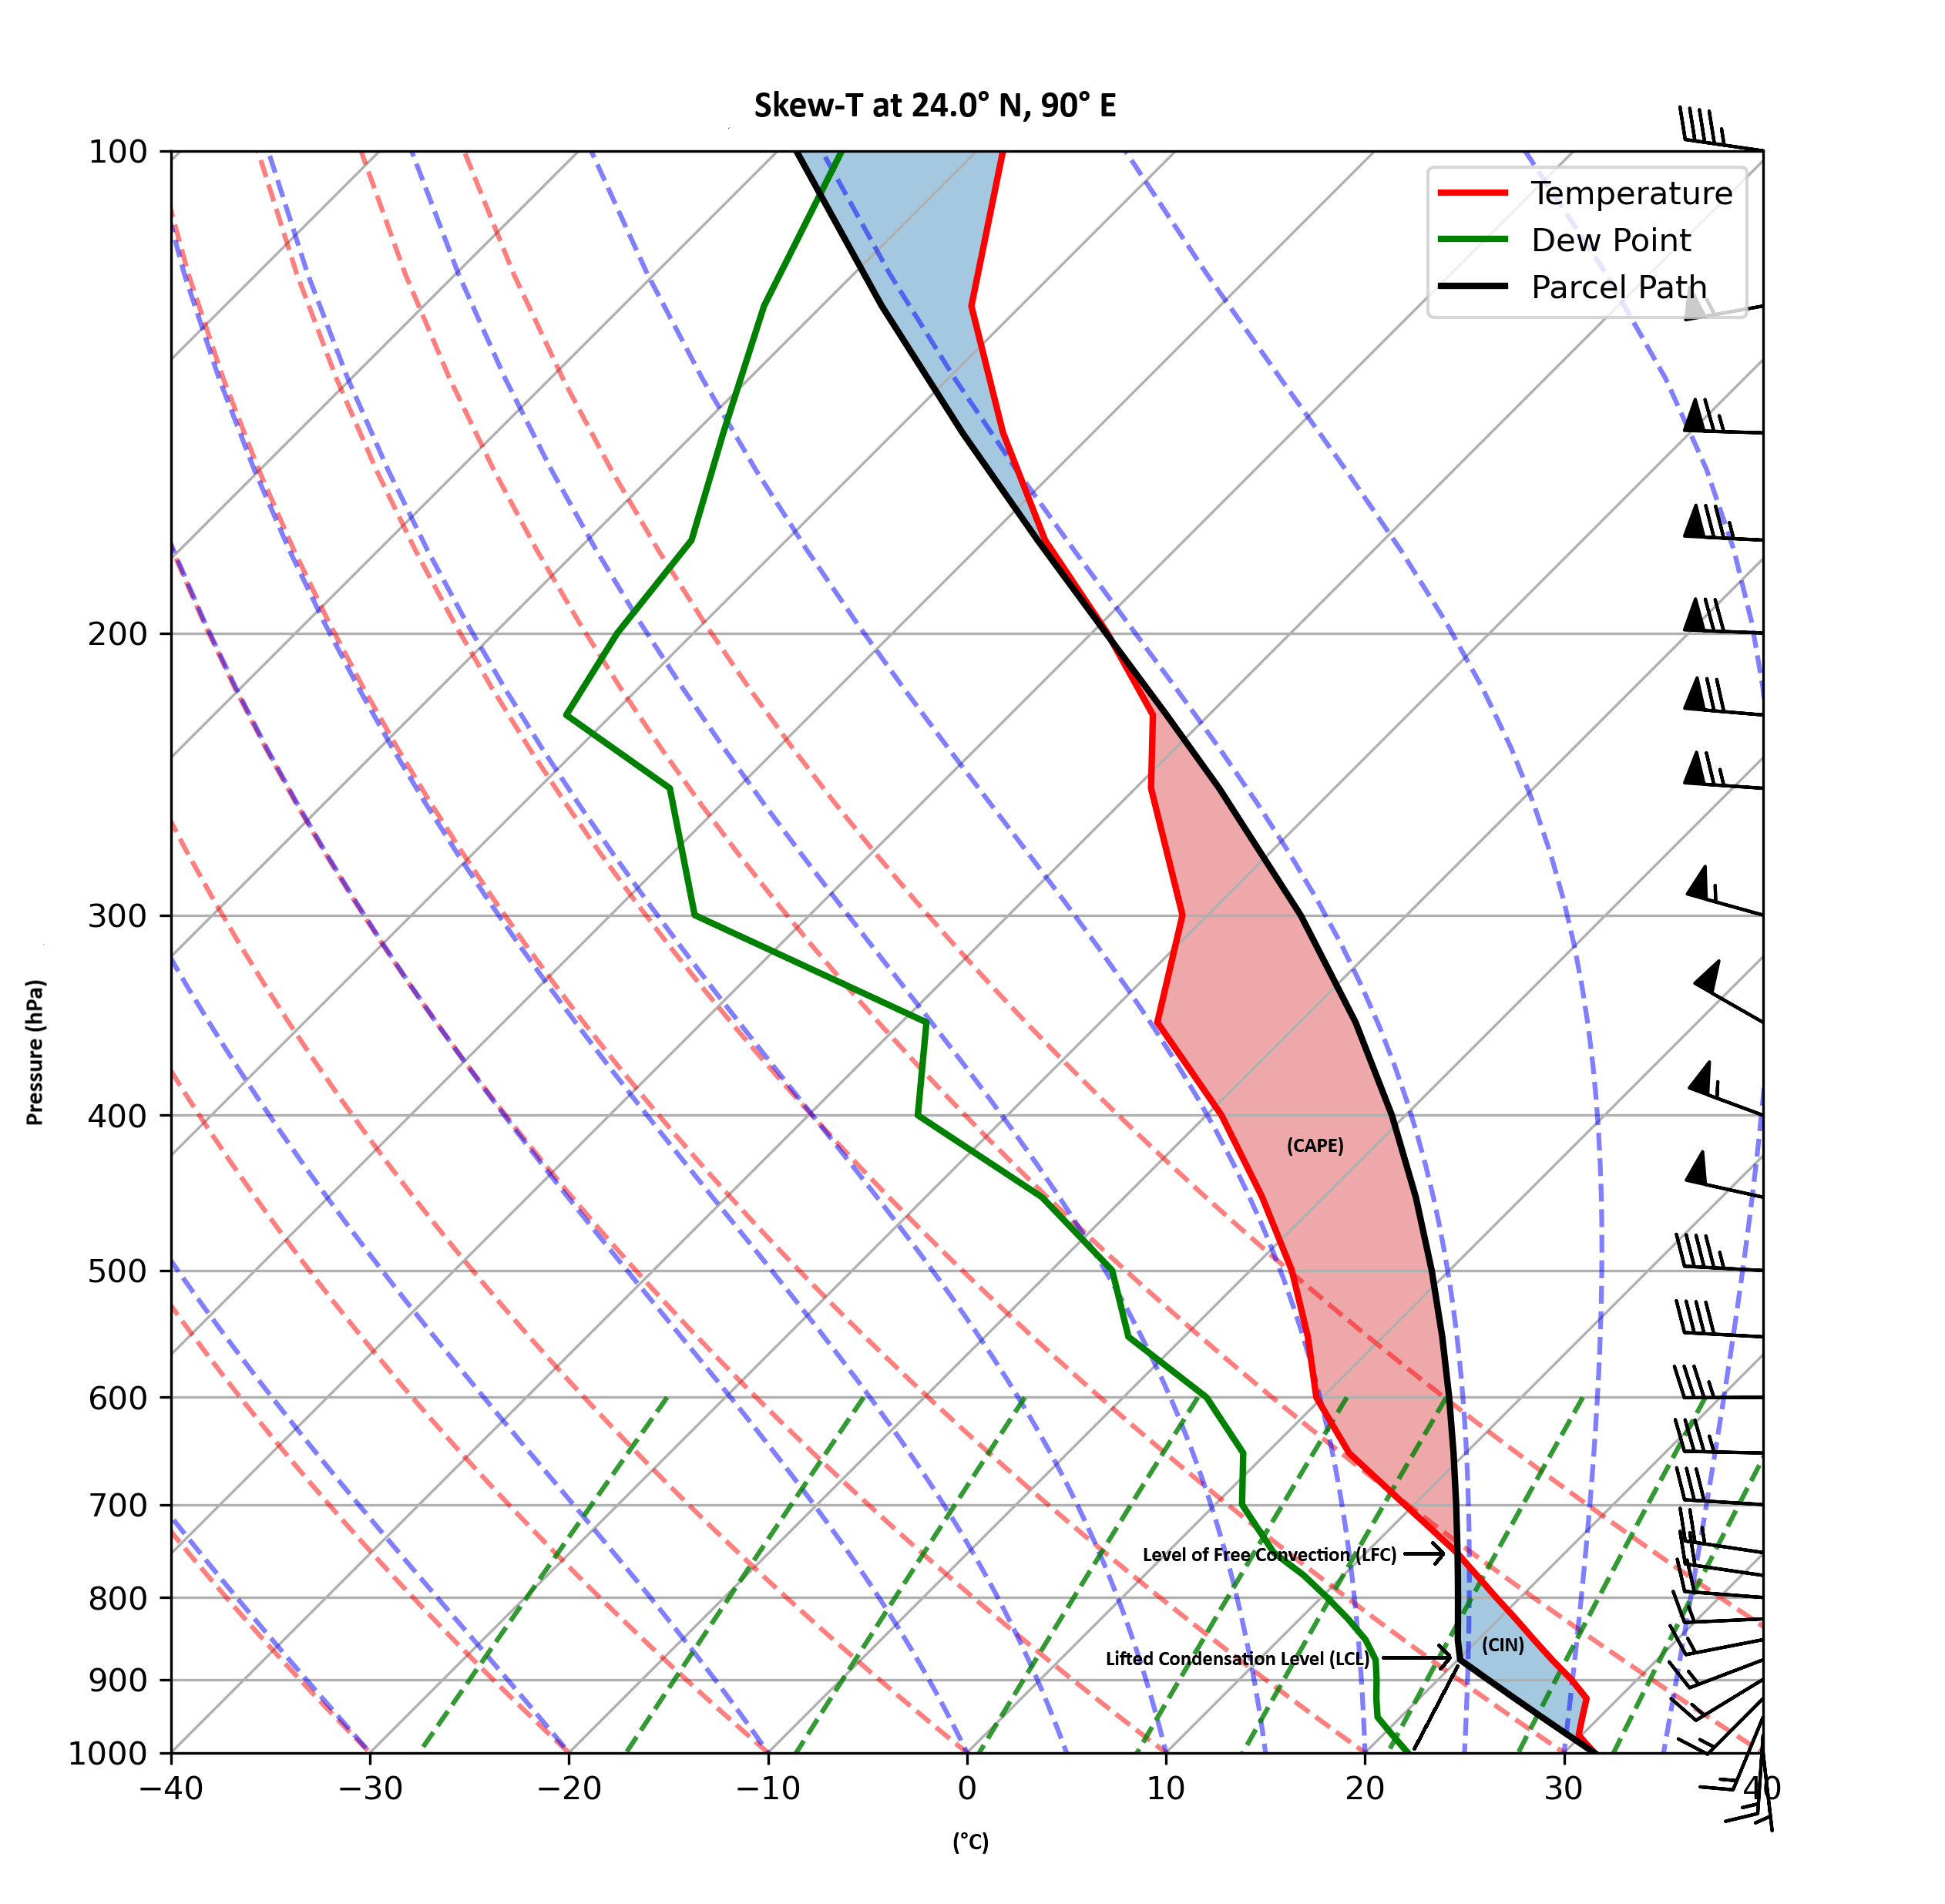
First, here is a (long) writeup on how to read a sounding, in case you wish to see it: https://www.weather.gov/source/zhu/ZHU_Training_Page/convective_parameters/skewt/skewtinfo.html. Also, if you need a review of how to read the wind barbs, here is a link: https://www.weather.gov/hfo/windbarbinfo. You can clearly see the southerly winds near the surface, but the winds rapidly become westerly with height. The temperature (in red) and dew point (in green) profiles show a warm humid air mass with part of the sounding being at the dry-adiabatic lapse rate (9.8 C/km in the vertical; dry-adiabatic lapse rates are indicated in the sounding by the dashed red line). The is a lot of instability above the Level of Free Convection (LFC) as is indicated in the red area between the temperature of the atmosphere in the sounding and the air parcel which is light-weight and therefore lifted through the atmosphere (if there's a trigger, which there most certainly is; note that there is CIN (Convective Inhibition) lower down which initially will inhibit convection (where the parcel is cooler than the ambient air--but if an air parcel can overcome this via warming below or cooling above or extra humidity below, or there's a trigger above this layer to force air upward--look out!). Locations just a little farther west had a greater depth at the dry-adiabatic lapse rate due to better mixing in the hotter drier atmosphere there. The atmosphere at and above 600 hPa (about 5 km above the surface) is less unstable.
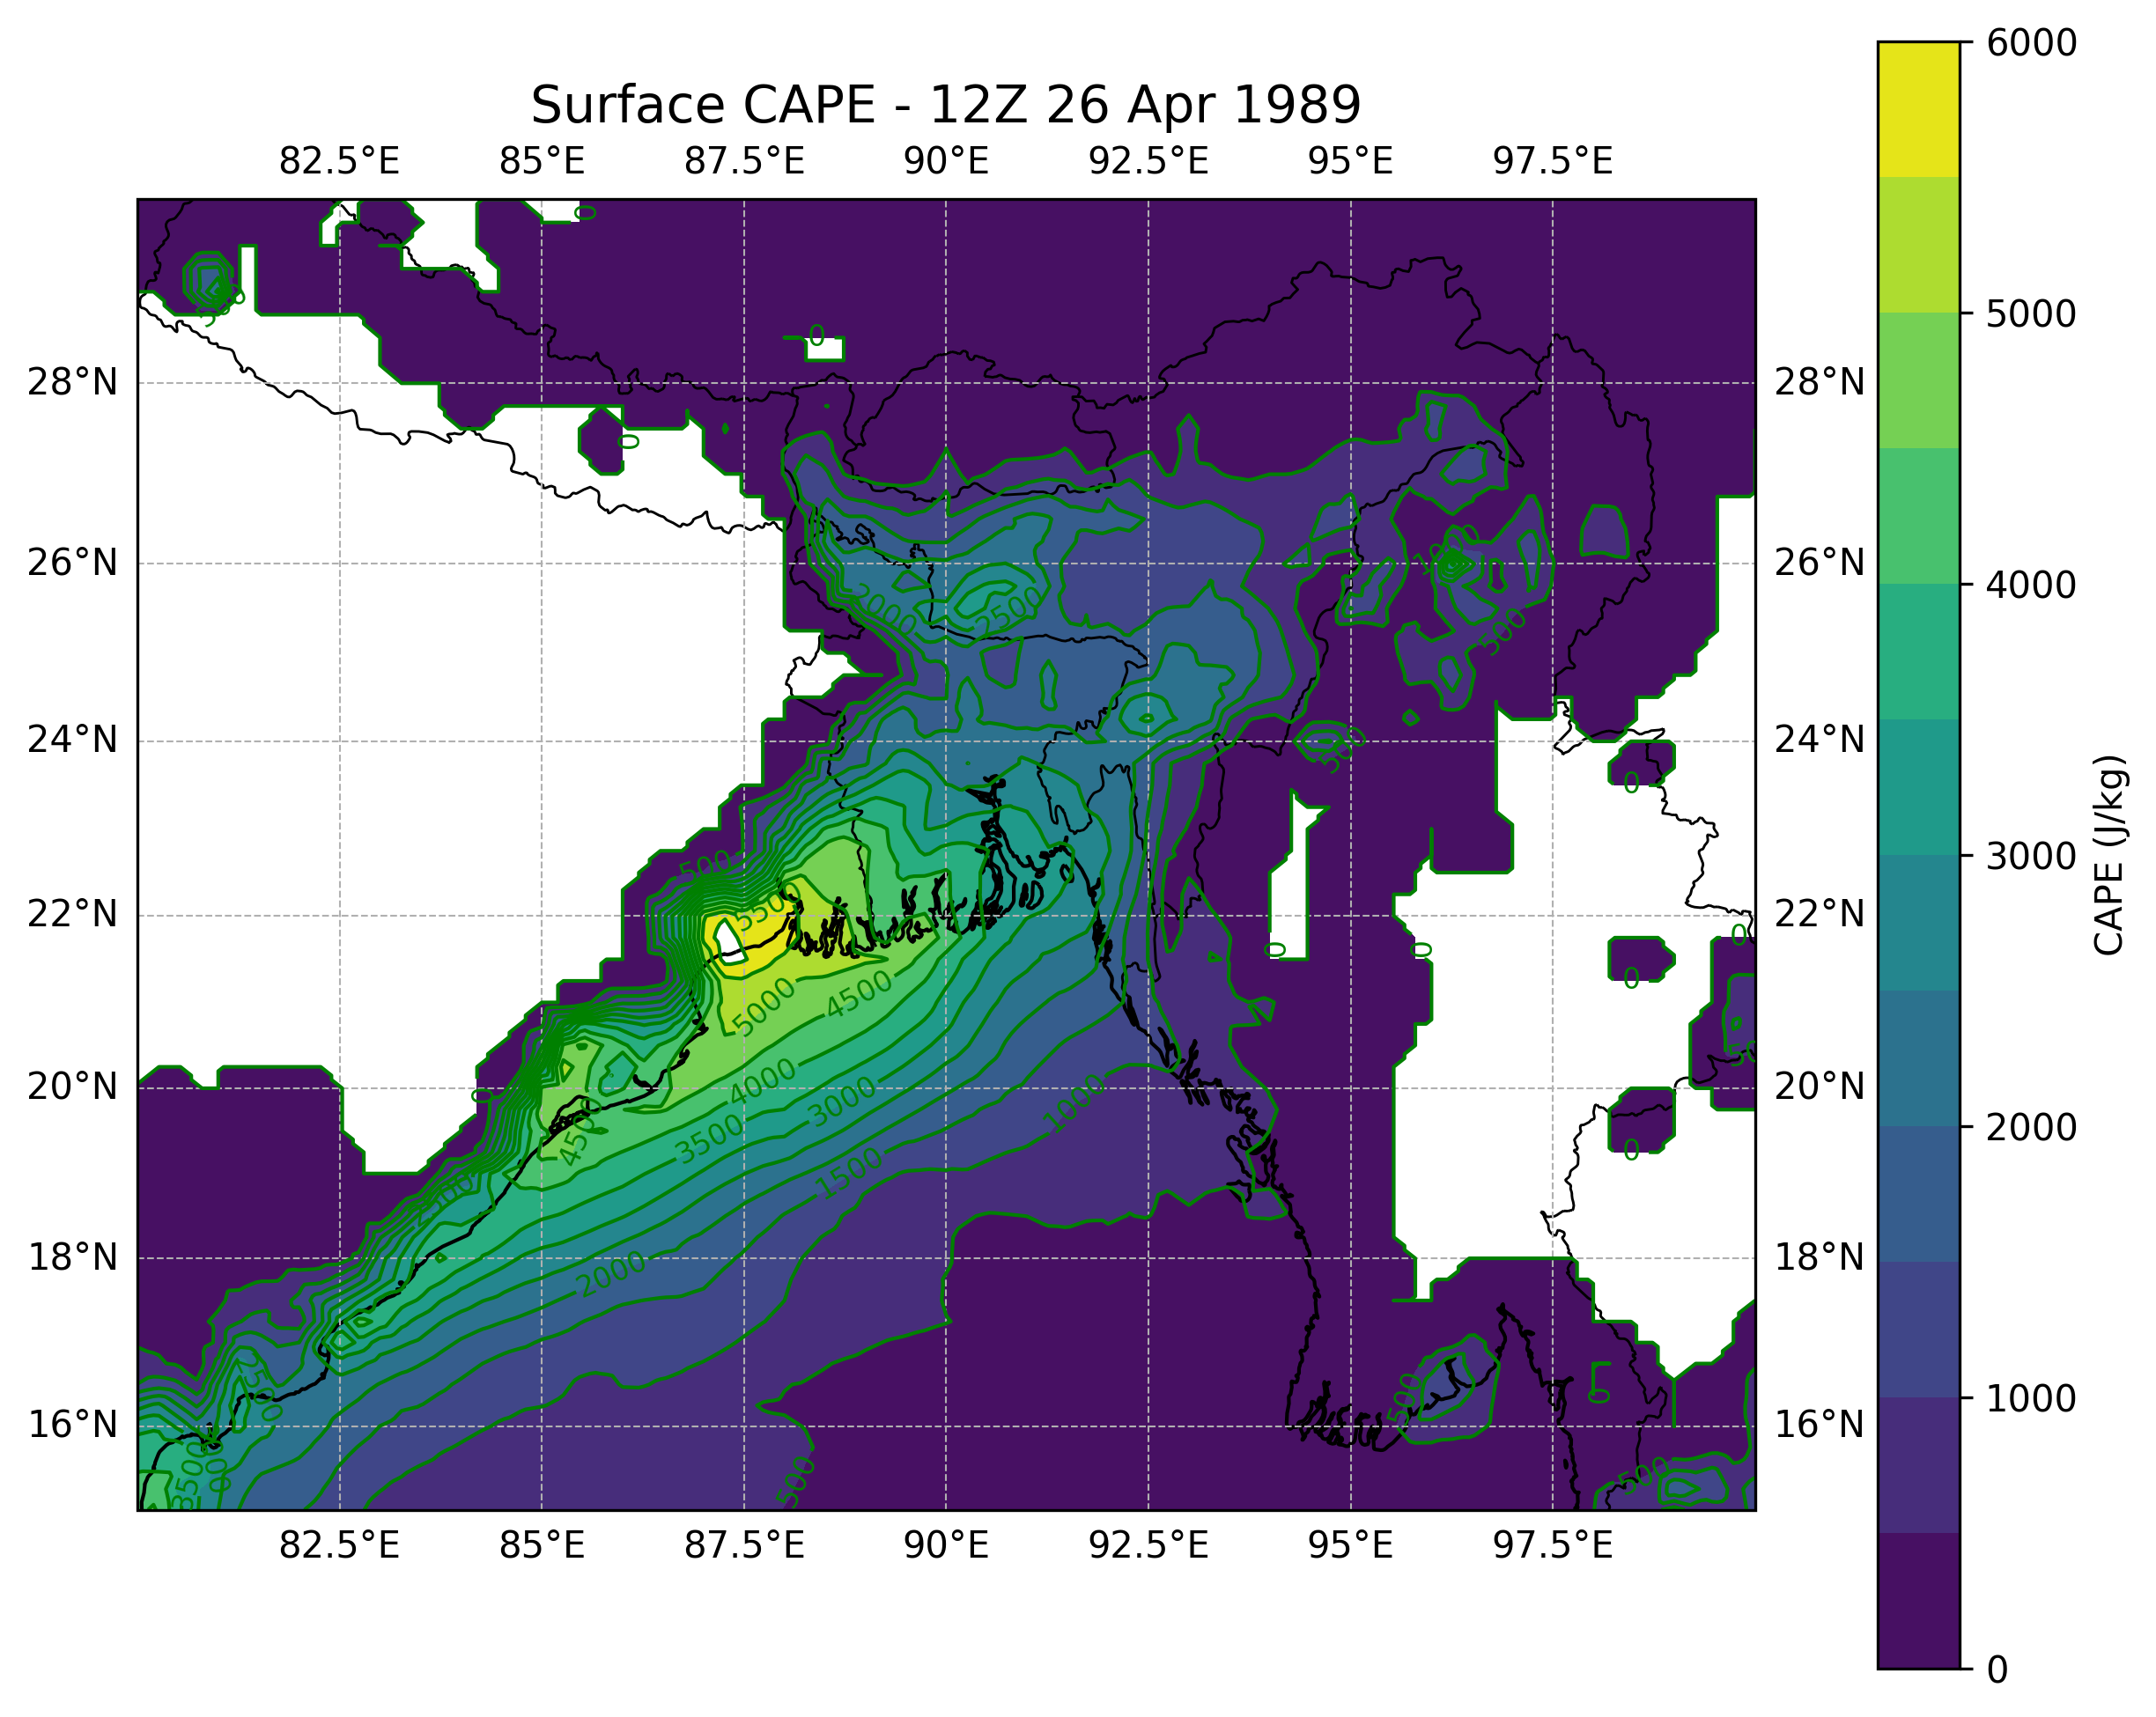
Next, let's look at the CAPE (Convective Available Potential Energy, J/kg), which is a measure of the energy available to lift the air through the atmosphere because the lifted parcel will be lighter (due to higher temperature) than the preceding environment at the various levels (it's convective as this is really a giant heat engine). Humidity near the surface really helps because, as a gas, water vapor is lighter than the two biggest constituents of the atmosphere, nitrogen and oxygen. Therefore, CAPE (in this case, calculated from the surface, though it can be calculated from different height levels in the atmosphere) is highest where it is quite humid, along the coast of the Bay of Bengal (with some modeled values as high as 6000 J/kg). While severe weather likelihood is determined by a number of other parameters, generally values above 1000 J/kg can create severe thunderstorms, and values above 3000 J/kg are event better, though if there is a low-level stable layer (even with high values of CAPE), that can inhibit the development of the updrafts--at least for awhile. Note to the west over much of northern India, CAPE is zero, as the air mass is very dry to the west of the dry line, as seen in the dew point temperature (2 meters above the surface which reflects the standard gauge height) image below.
The dew points over parts of the northwestern Bay of Bengal and adjacent coast are around 26 C/79 F, which would be typical of the muggiest days of the summer along the Gulf of Mexico coast of the US (mostly only the areas that have extensive corn fields in the Midwest would have higher dew points in the US at any time during summer). The dry line is quite apparent as just a short distance to the west over northern India, dew points are around 4 C/40 F. In the US, a dry line frequently occurs in the southern Great Plains in the summer and can be a trigger for severe weather due to the sharp contrast of the hot dry air to the west and the warm humid air to the east, with added surface convergence along the dry line which forces lifting, and the same thing occurs near the India-Bangladesh border given that spring conditions in northern India simulate the dry southwestern US, but Bangladesh in spring simulates the (mostly summer) conditions along the US Gulf Coast.
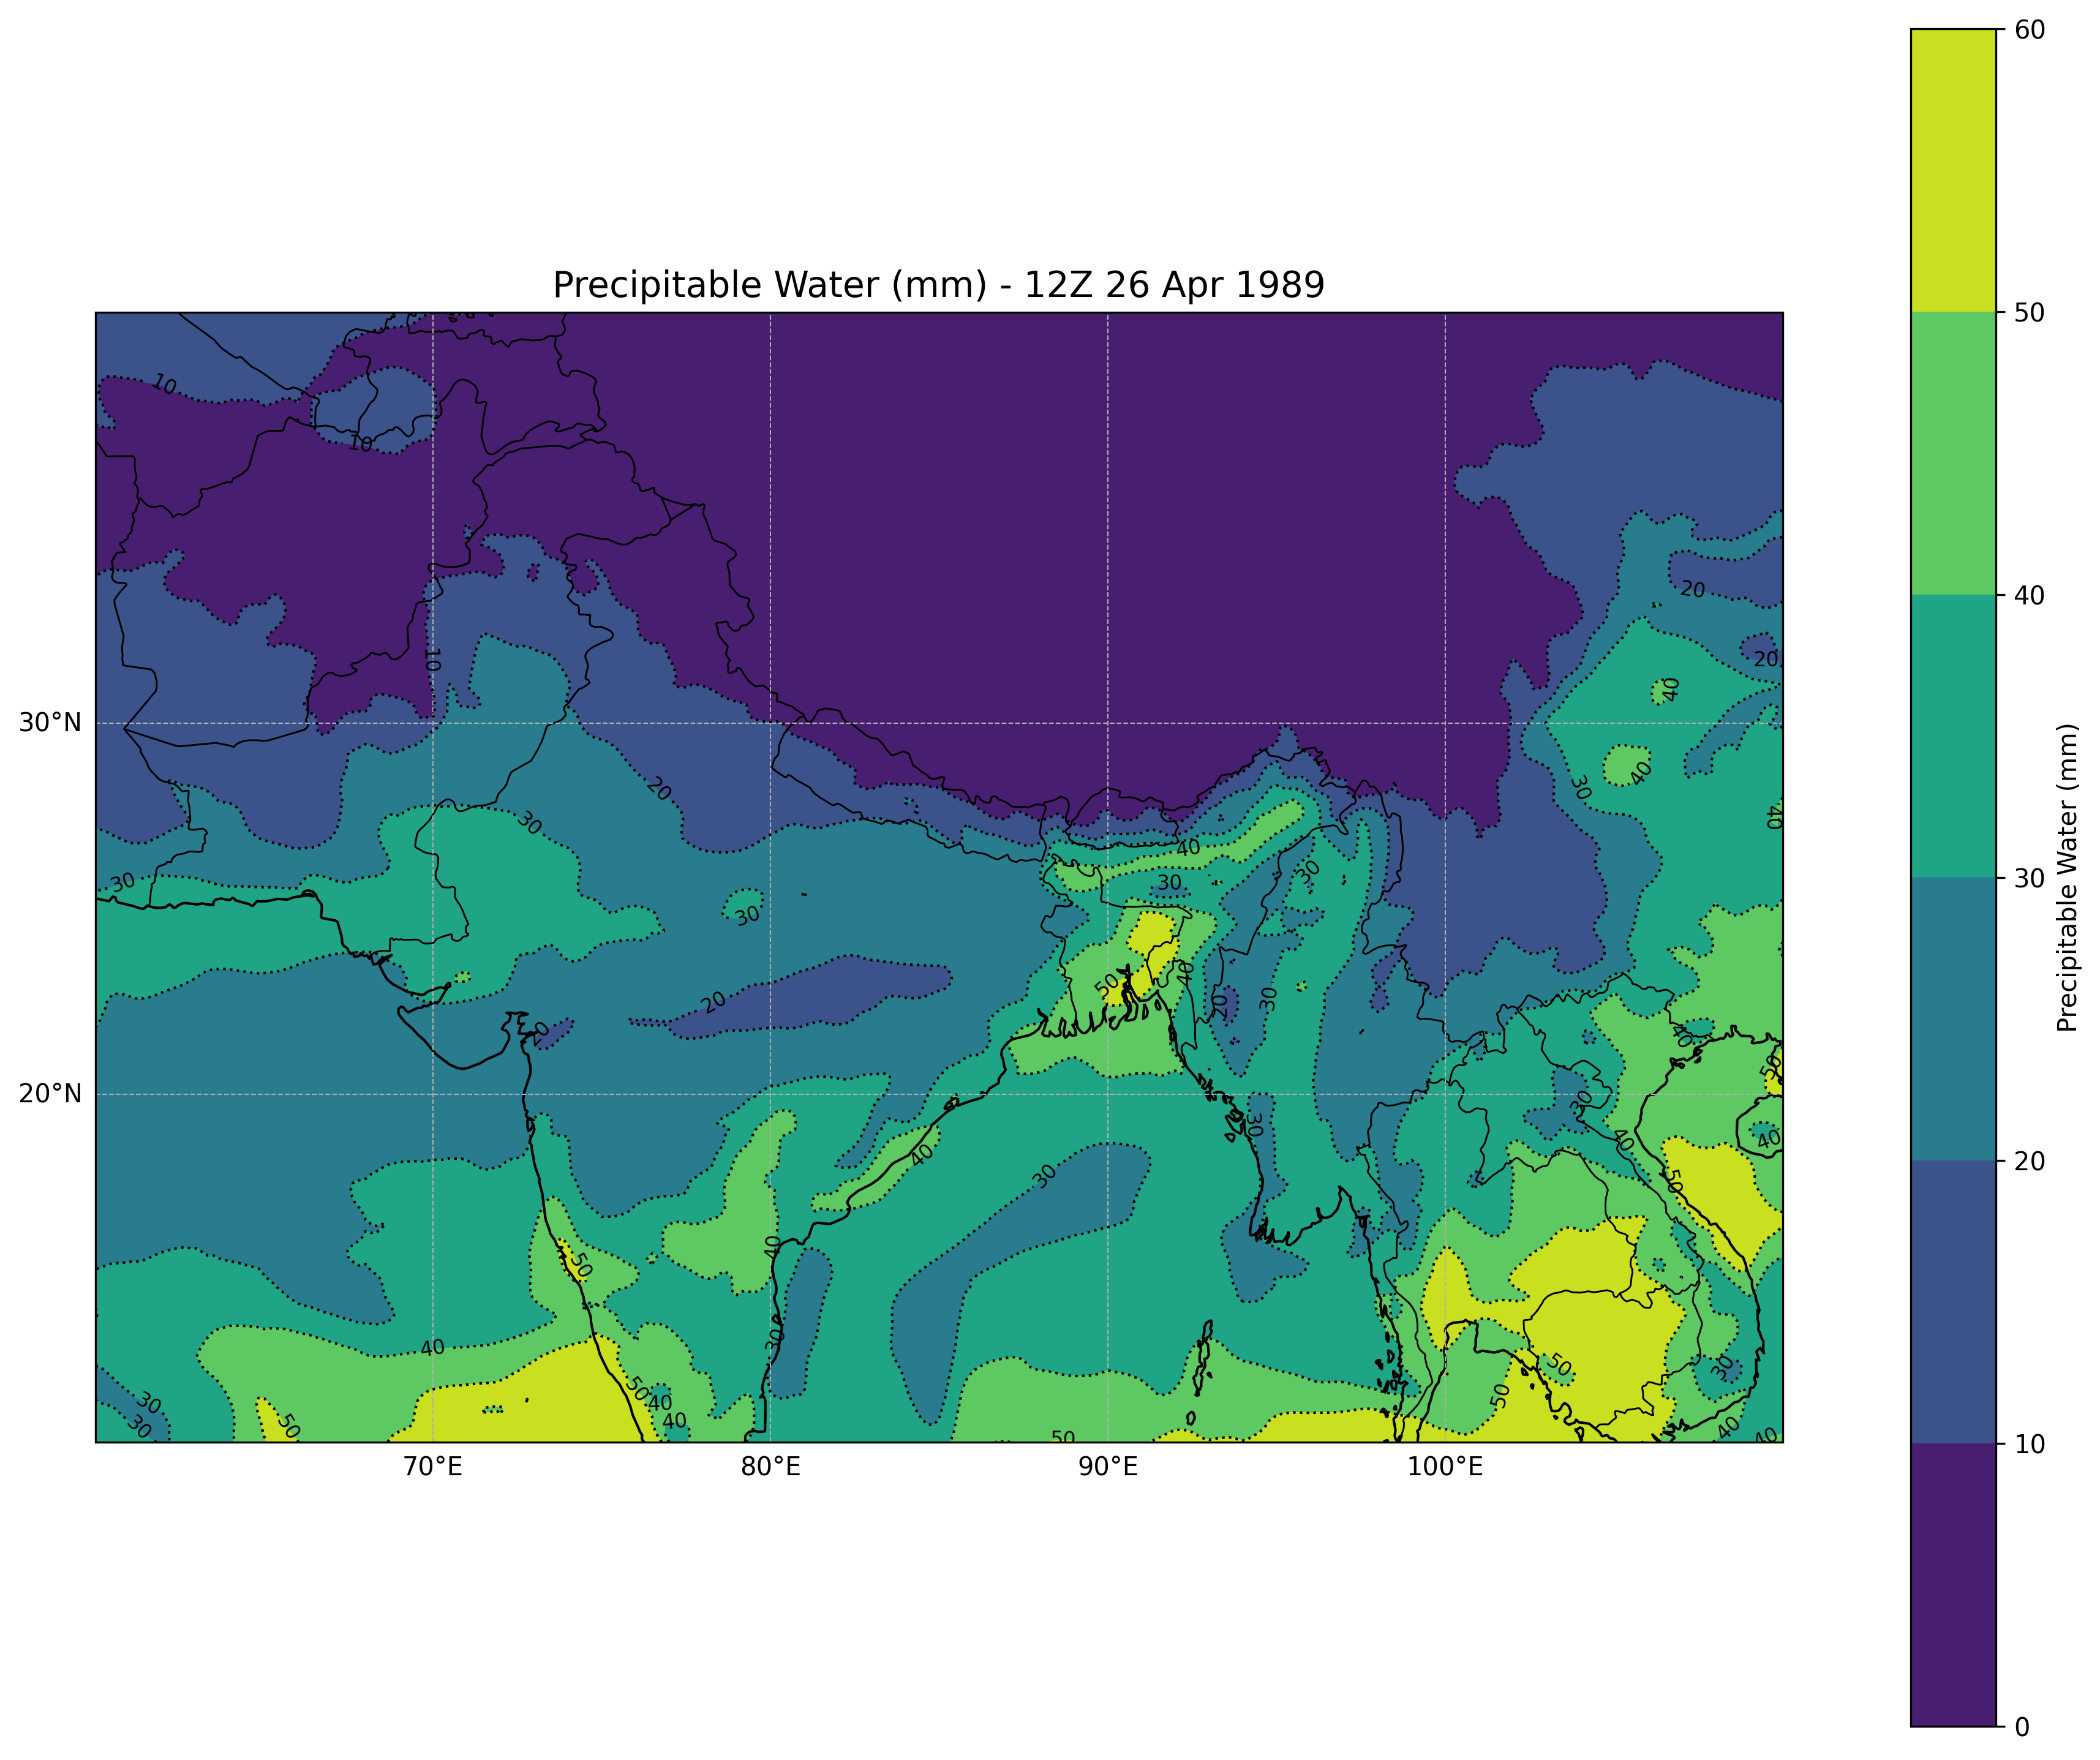
One way to look at how much moisture is in the atmosphere is by viewing the total amount of water vapor through the atmospheric column (or at least between 1000 and 300 hPa, which is roughly the surface to about 9 km/30,000 feet high; even if there are clouds above that, there is very little moisture at that high altitude because of the low temperatures). Sometimes this is called "precipitable water" (PW) or "total precipitation water (TPW), both of which are identified in millimeters of rainfall that would occur if all the water vapor in the column suddenly condensed and fell to the ground. It is also called "integrated water vapor" (IWV), and if so, that is usually expressed in kg/m
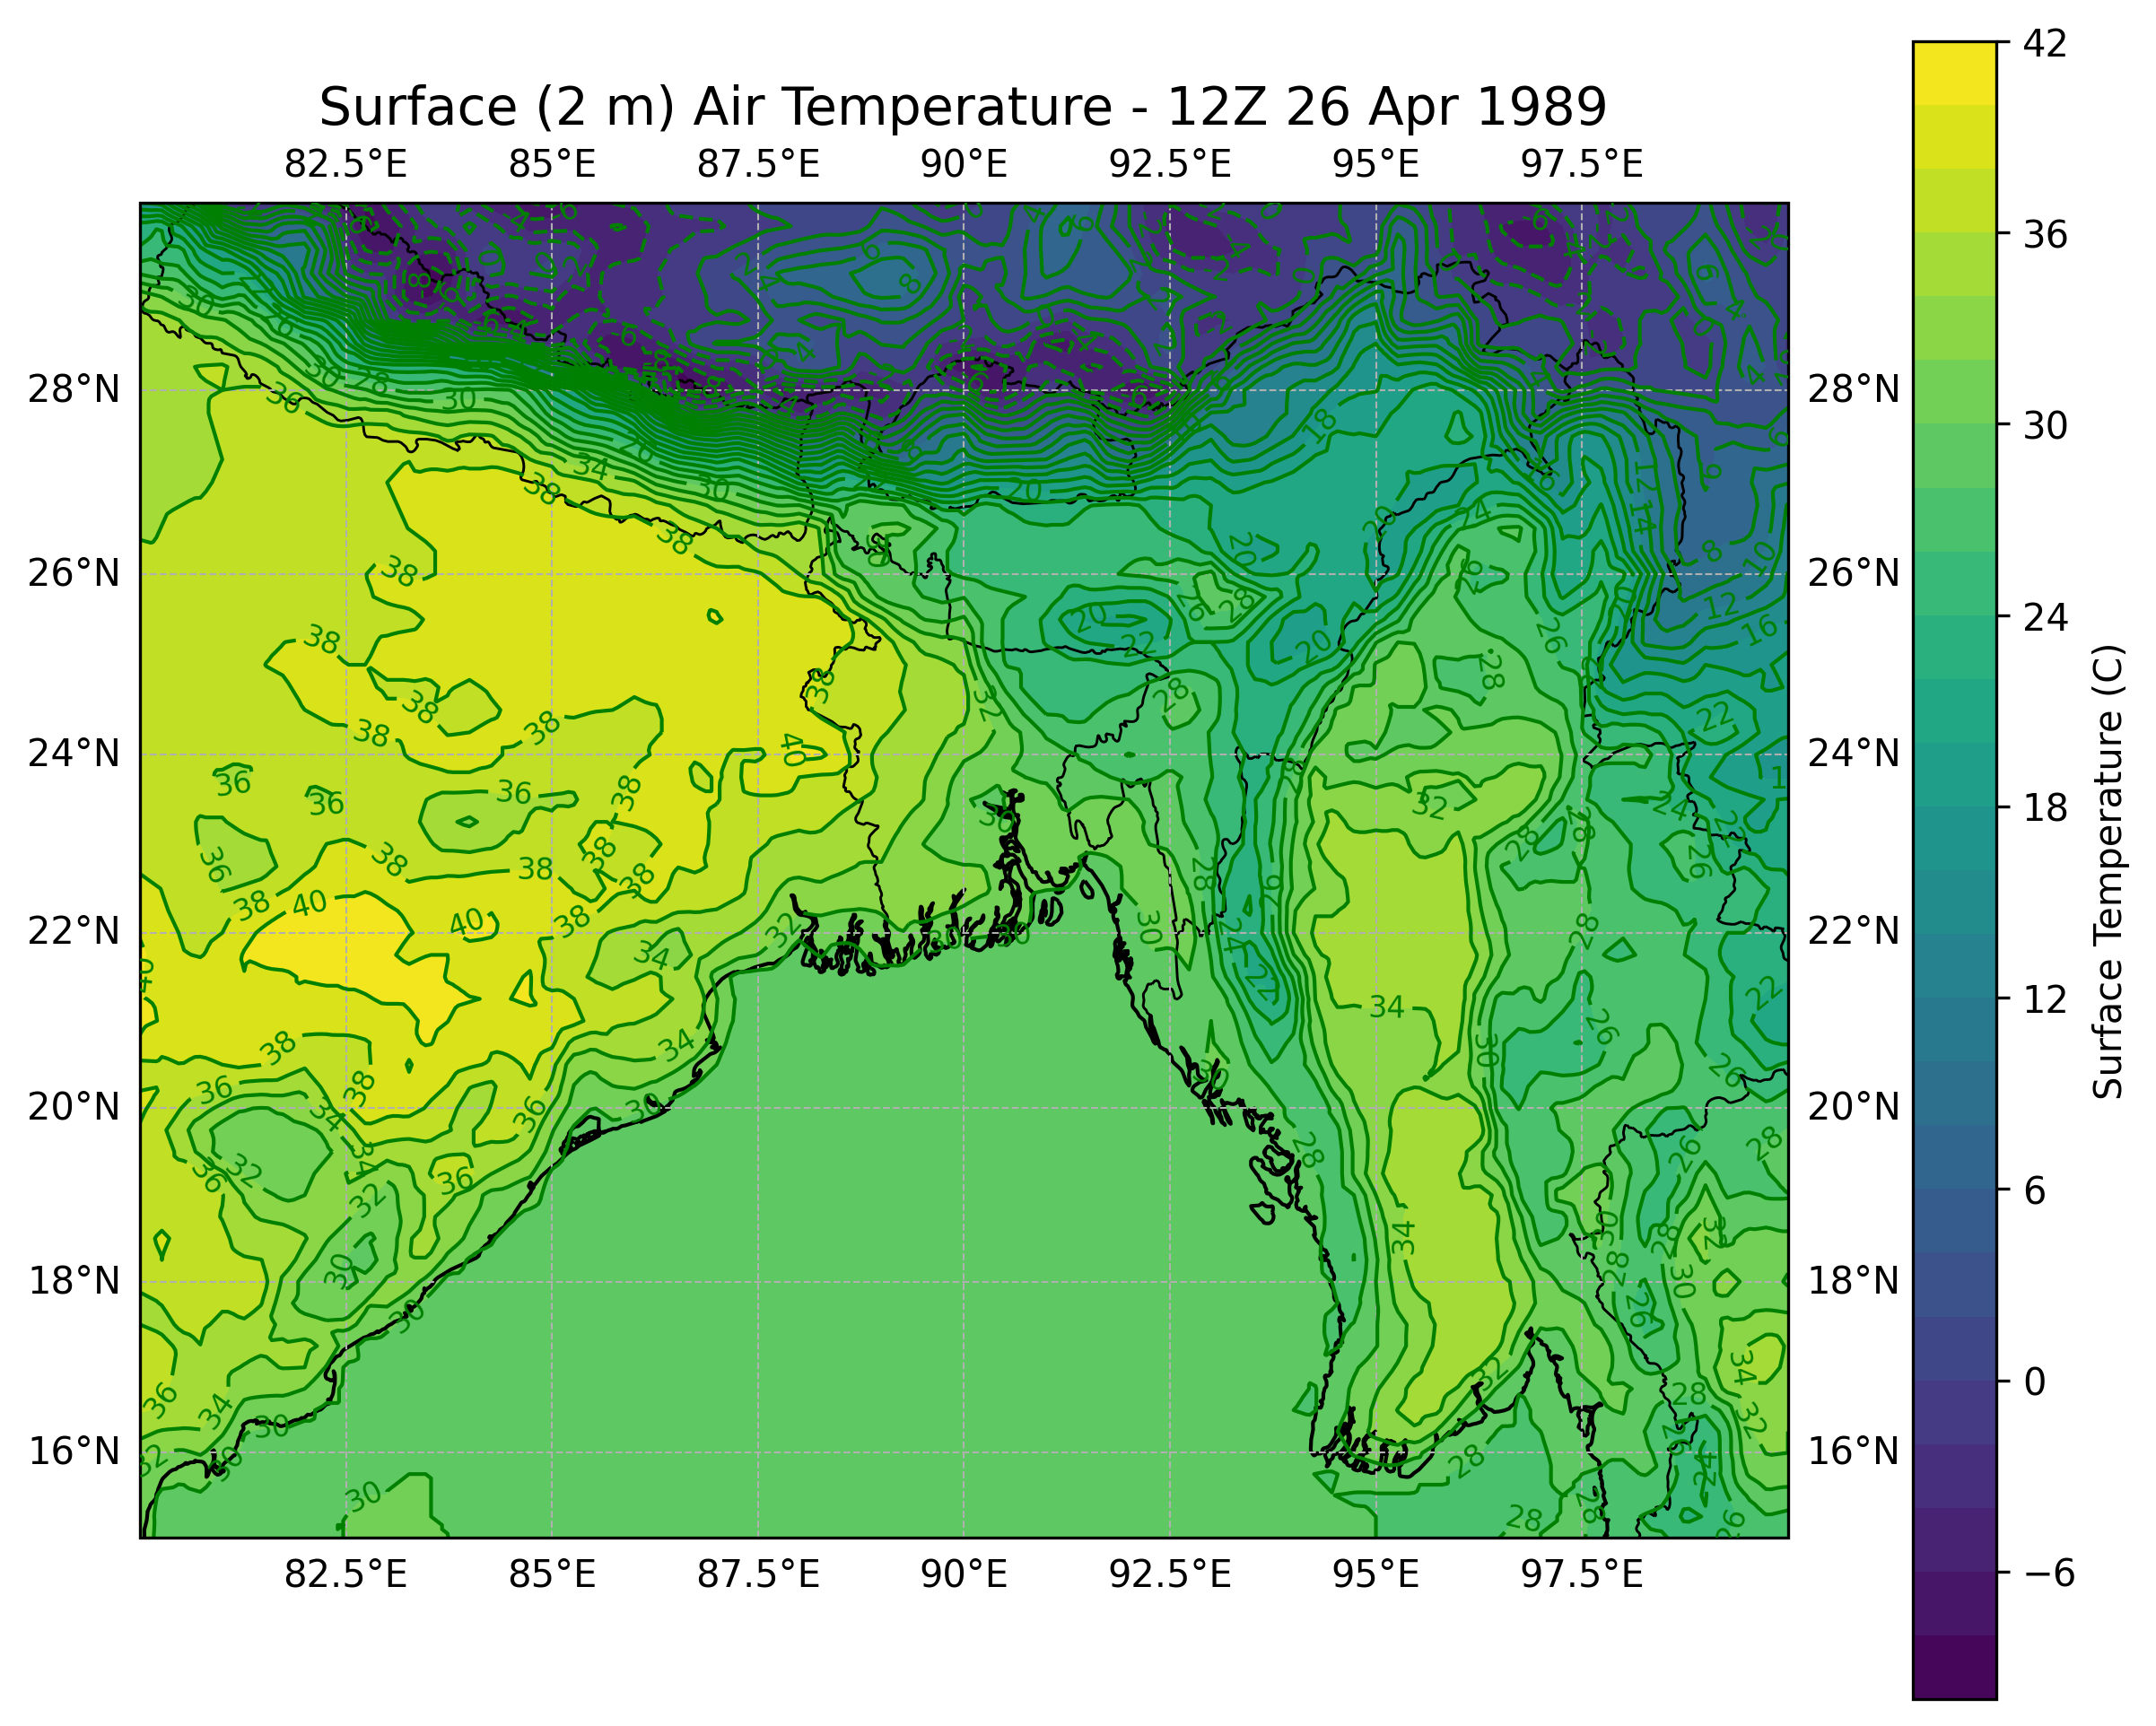
Now let's look at air temperatures (2 meters above the surface).
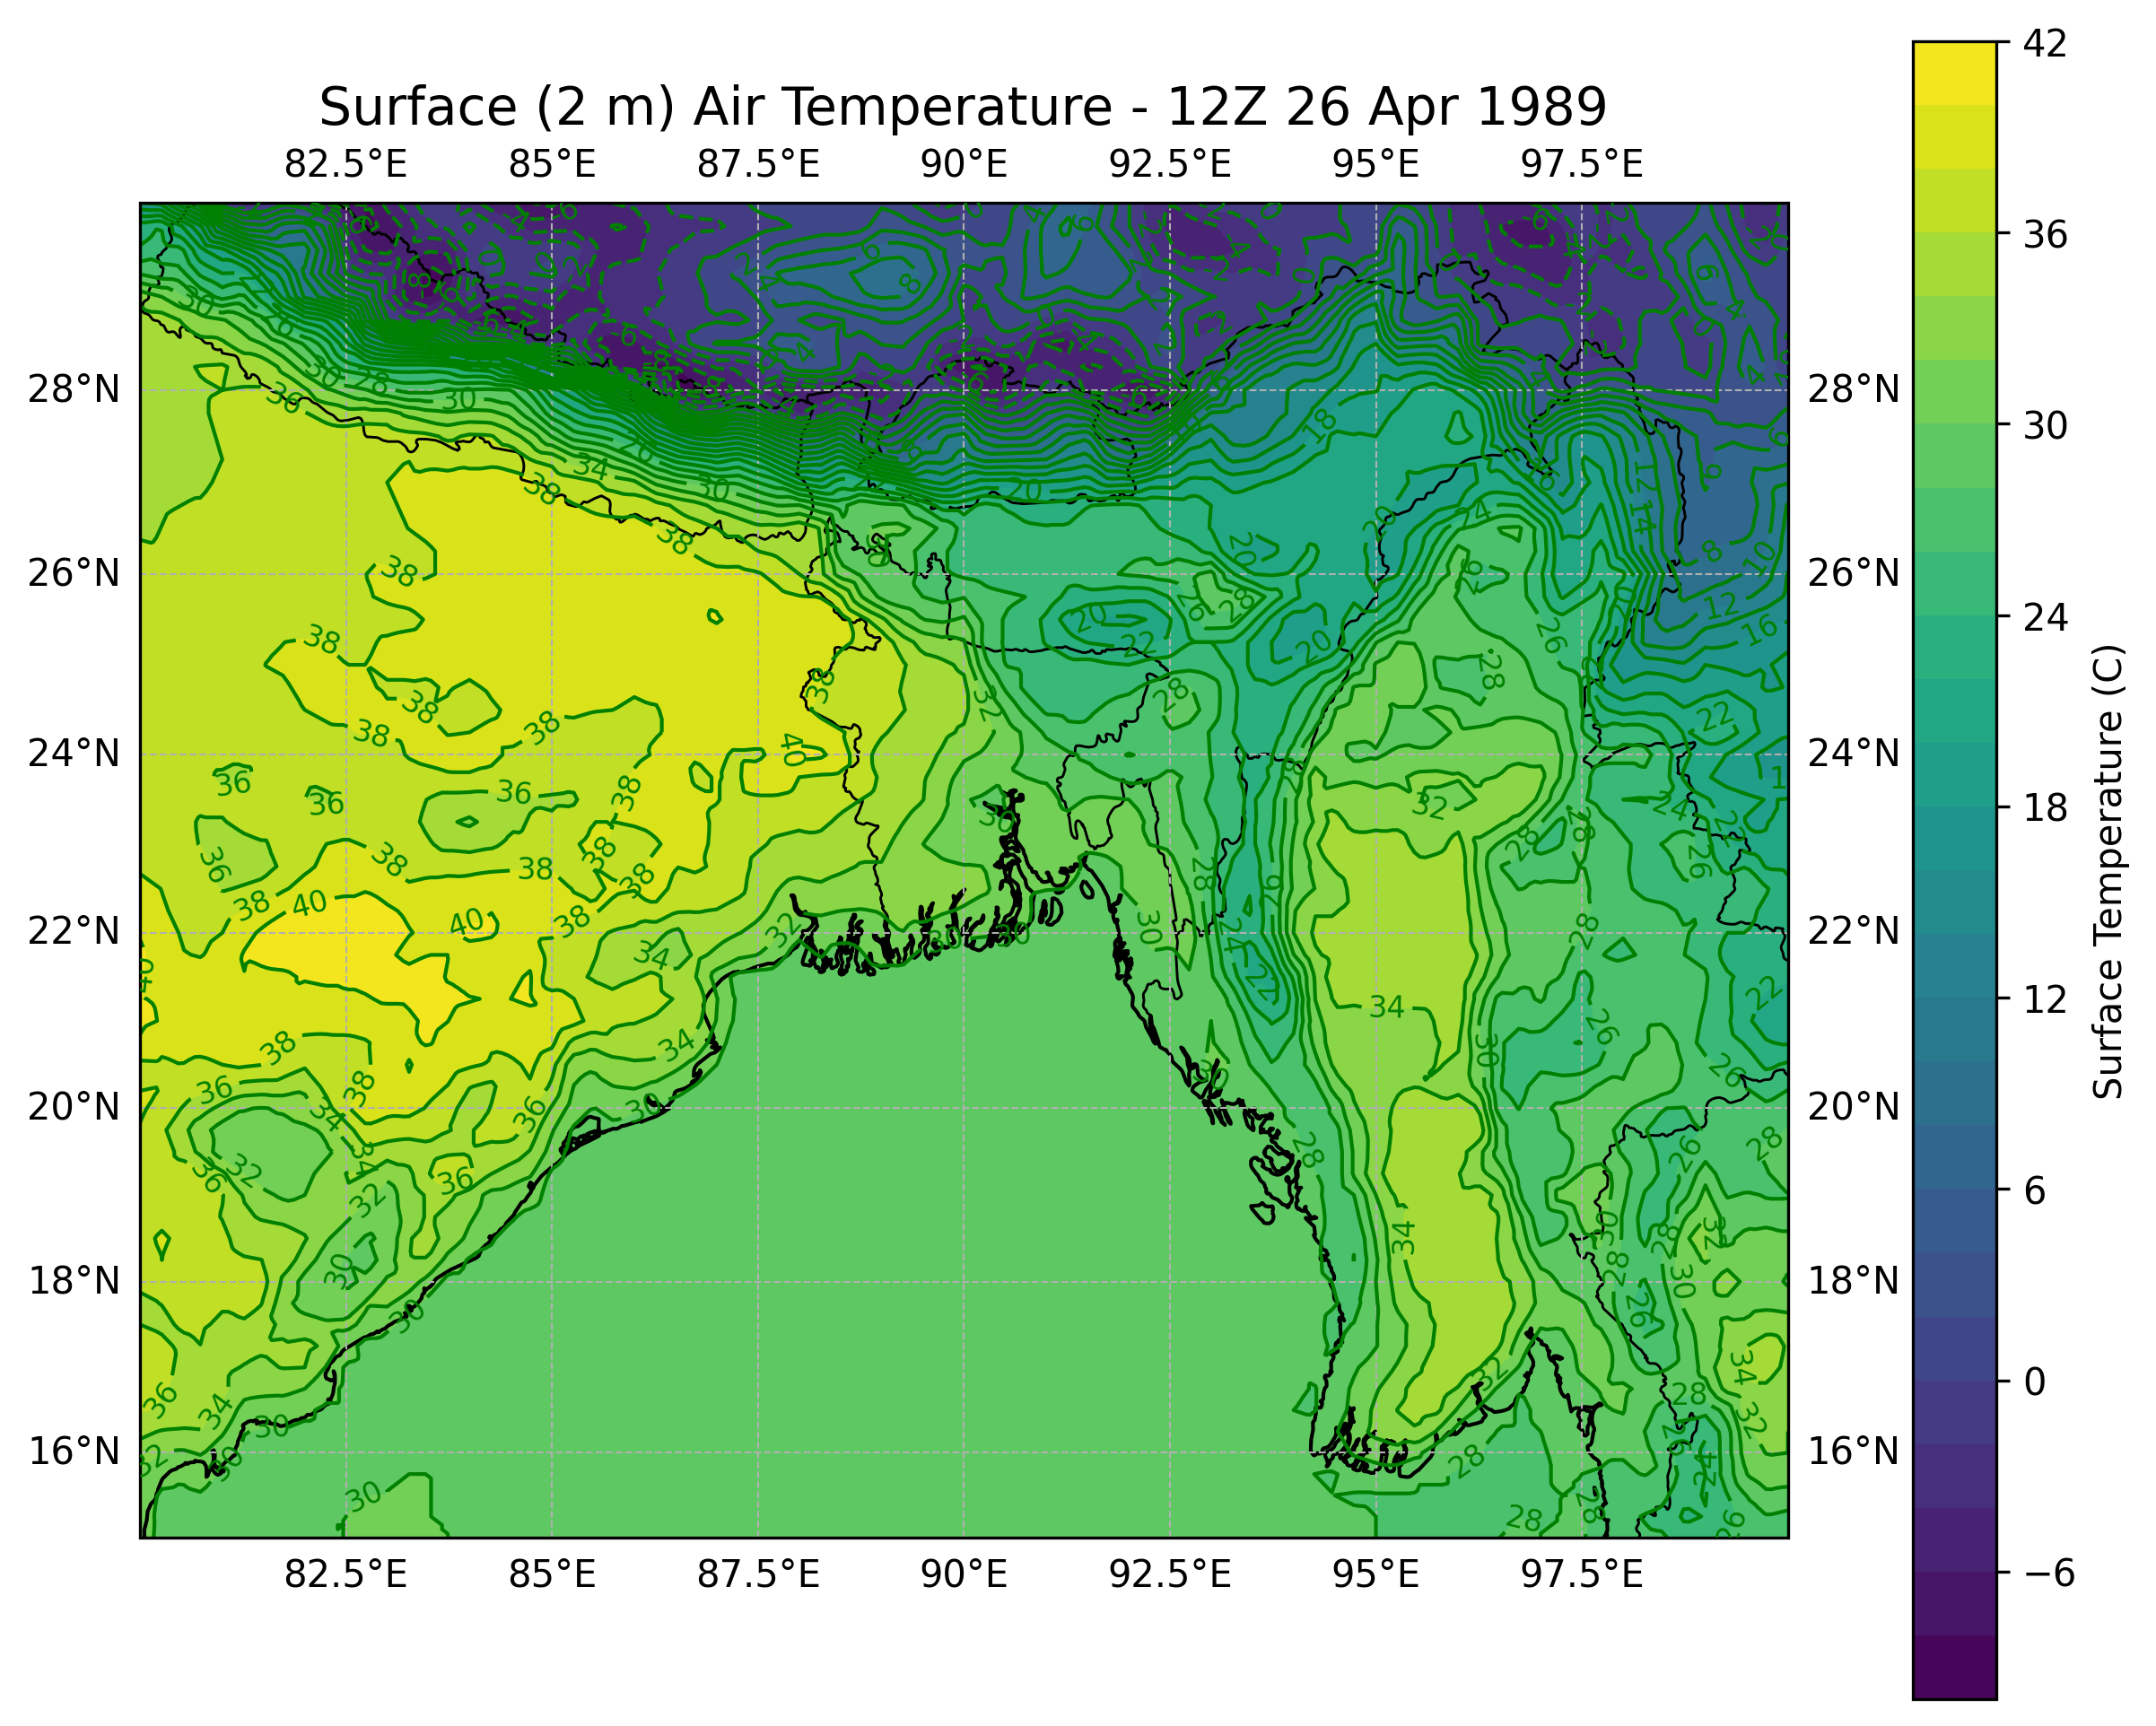
It is hot west of the dry line over northern India, but a little bit cooler to the east of the dry line due to the wind coming off the water of the Bay of Bengal. Looking at the MSLP (mean sea level pressure, the pressure converted to sea level to mostly compare apples-to-apples at higher elevations) and 10-meter winds (standard gauge height), one can see the location of the dry line and the associated convergence, as well as the low pressure from northern India to northwestern Bangladesh (ignore the MSLP over the Himalayas as pressures over really high mountains often do not convert as well, especially if there are variations in the air mass with height). One surface observation at 6 PM near the low center had a measured MSLP of 999 mb, matching what the reanalysis shows.
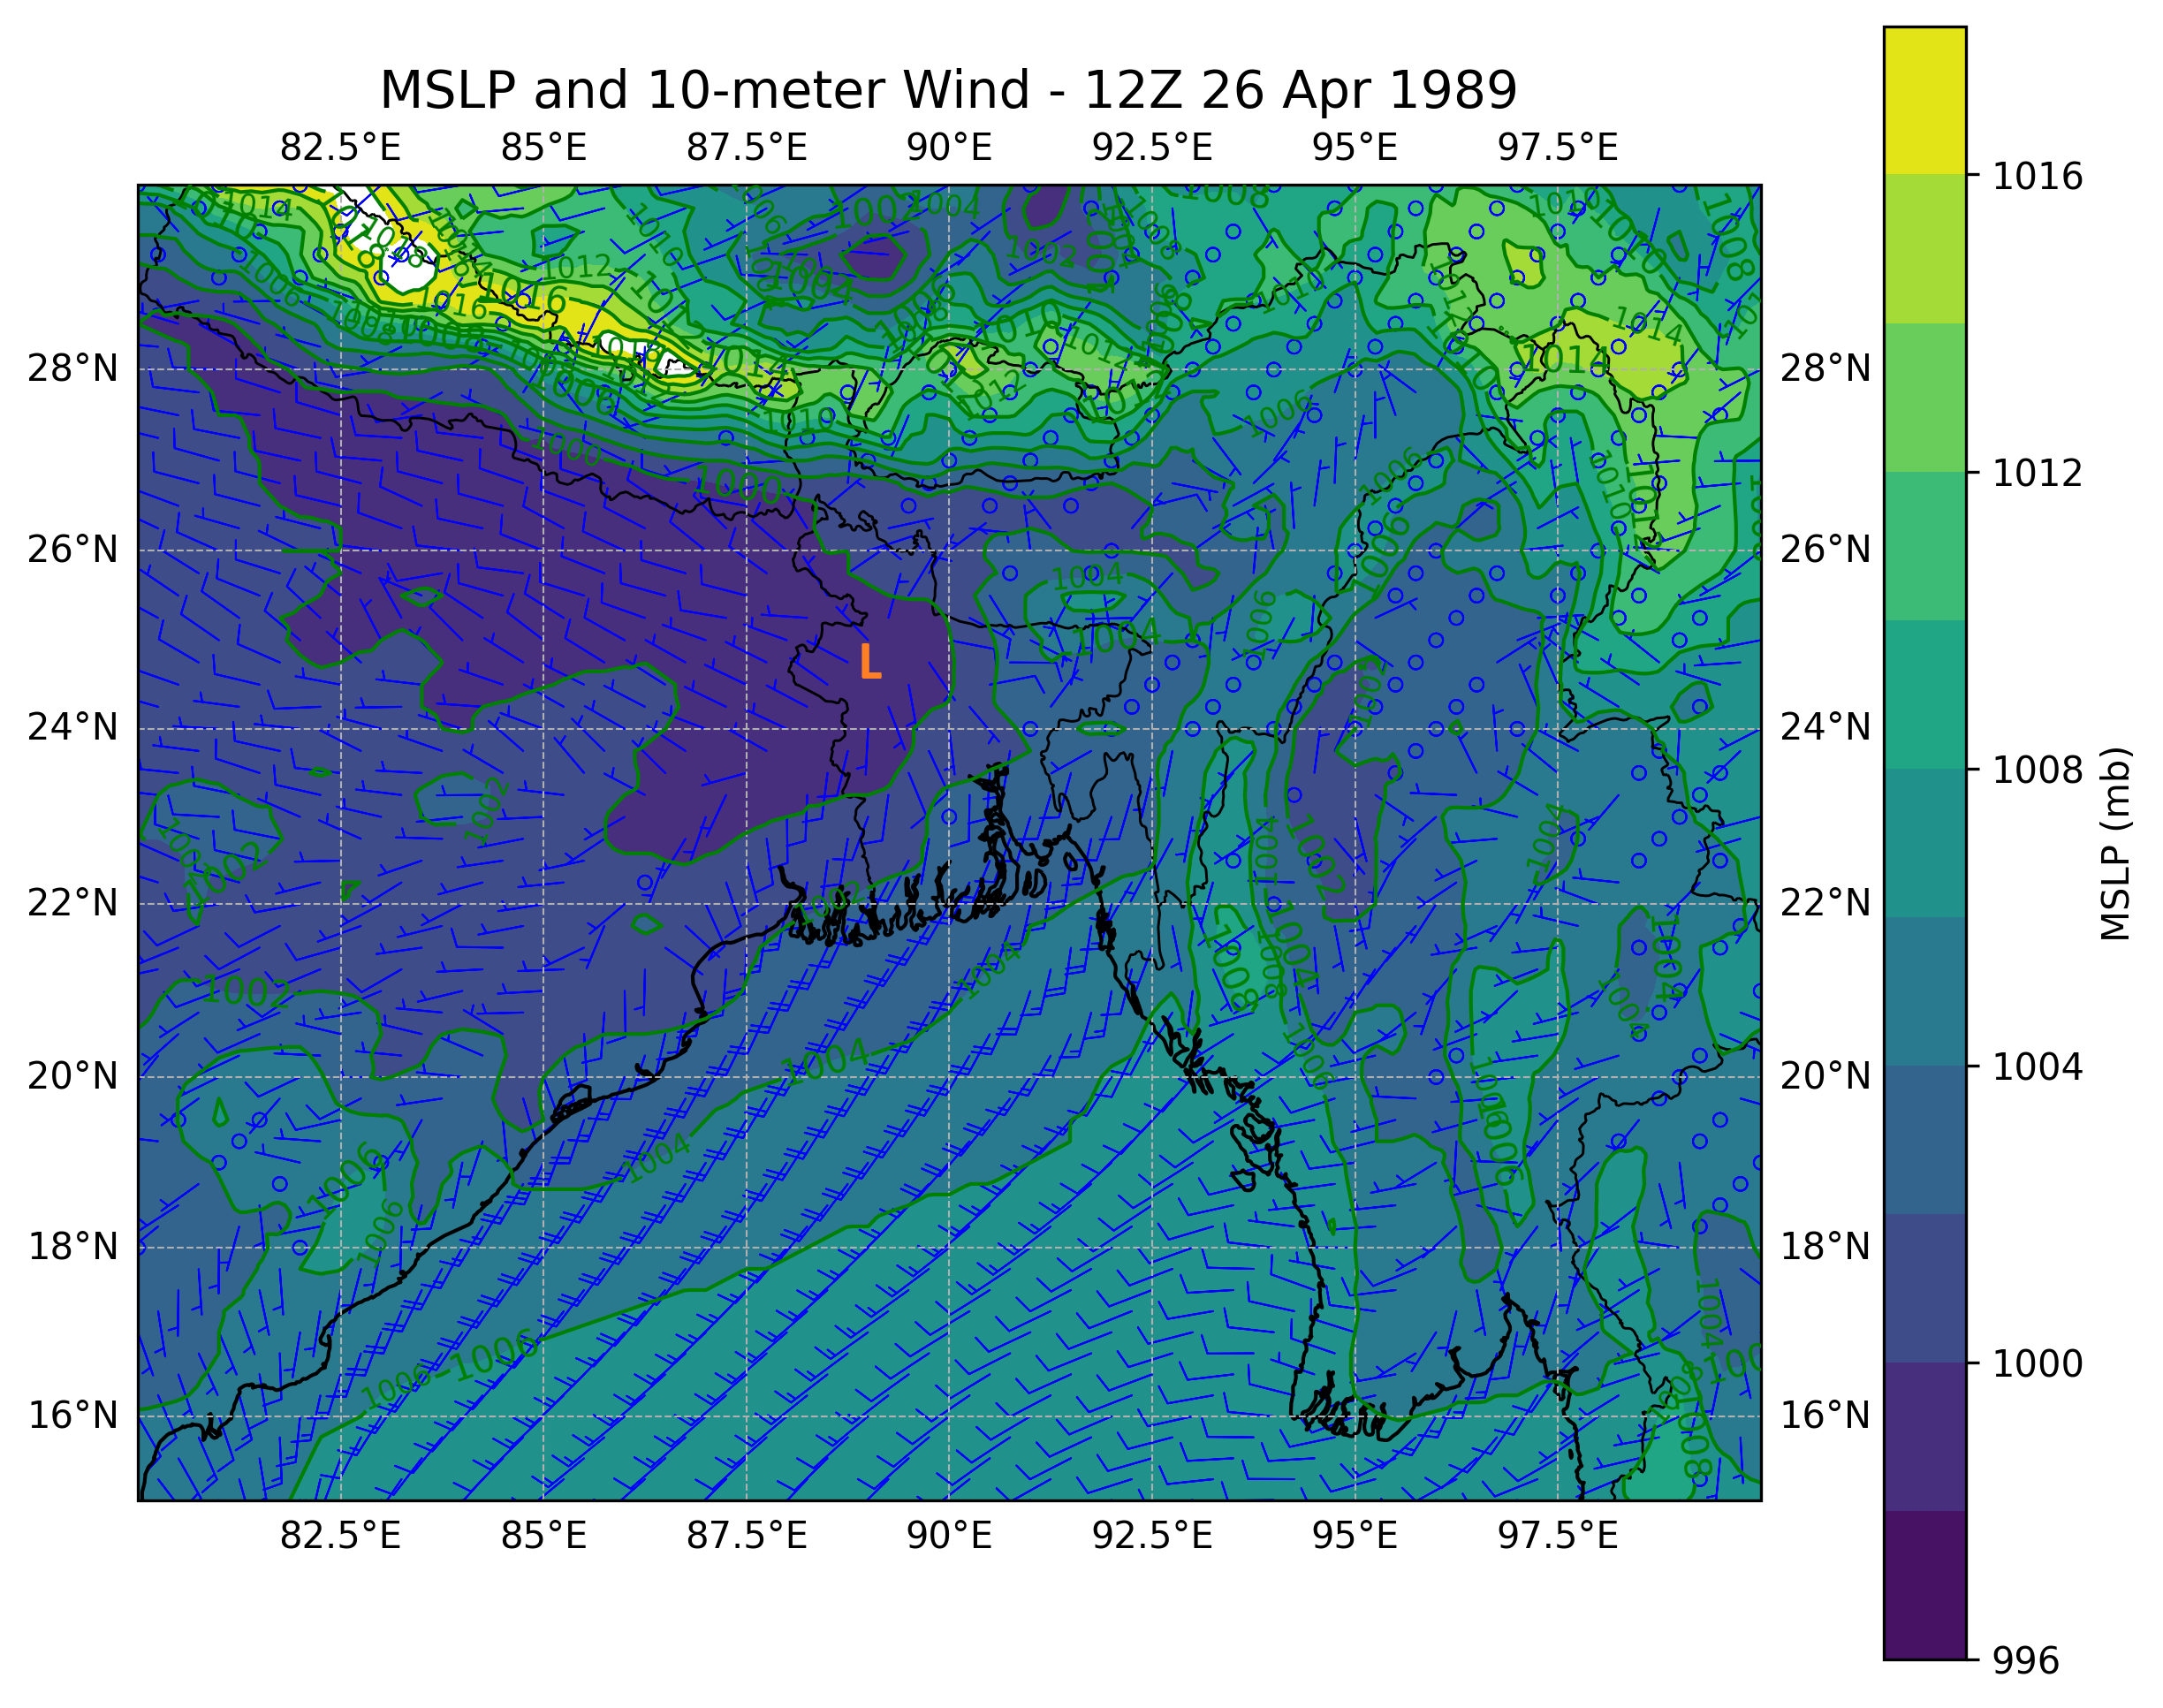
Thus, having the low to the northwest, combined with the dry line convergence provides the surface convergence of air which would aid the upward vertical motion in the low layers of the atmosphere (plus the CAPE, as already noted, would greatly amplify this in storms). Now, let's not forget the upper air.
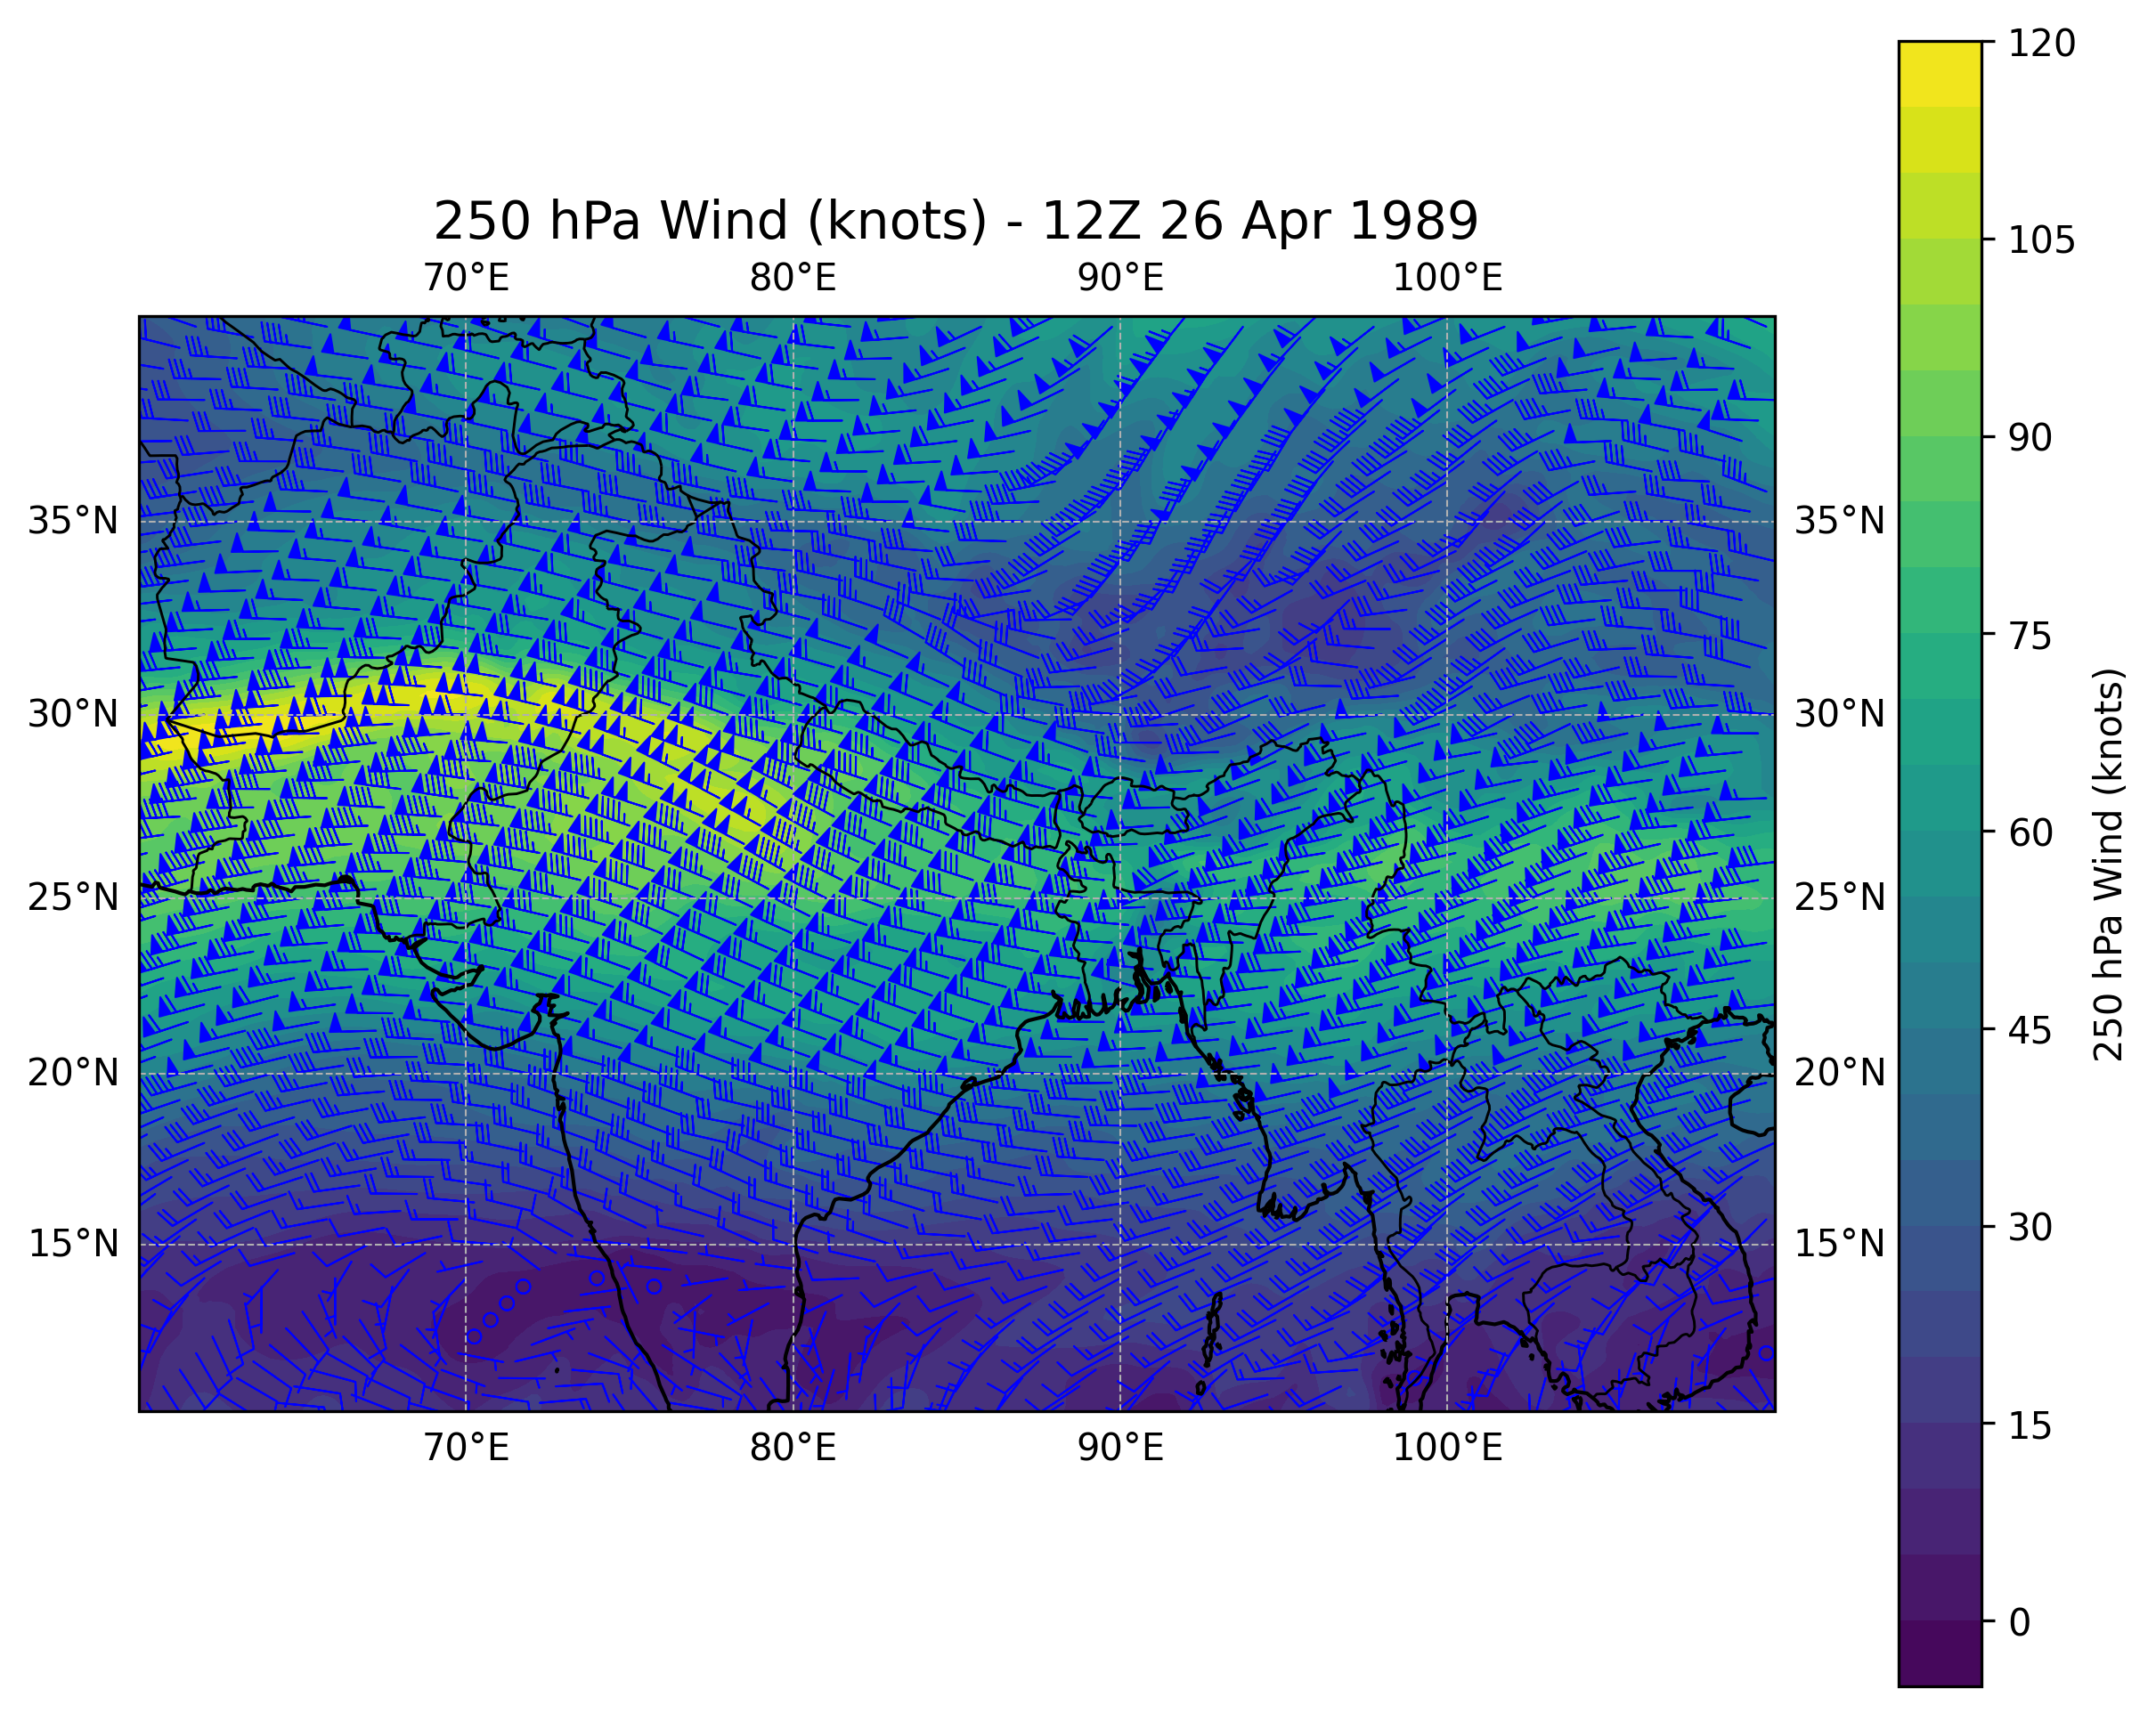
One can see the strong jet stream (based on 250-hPa winds) moving roughly west to east over India with winds over 100 knots (50 m/s or 115 MPH) over western India and points farther west, with a notable and important trough over and north of Bangladesh.
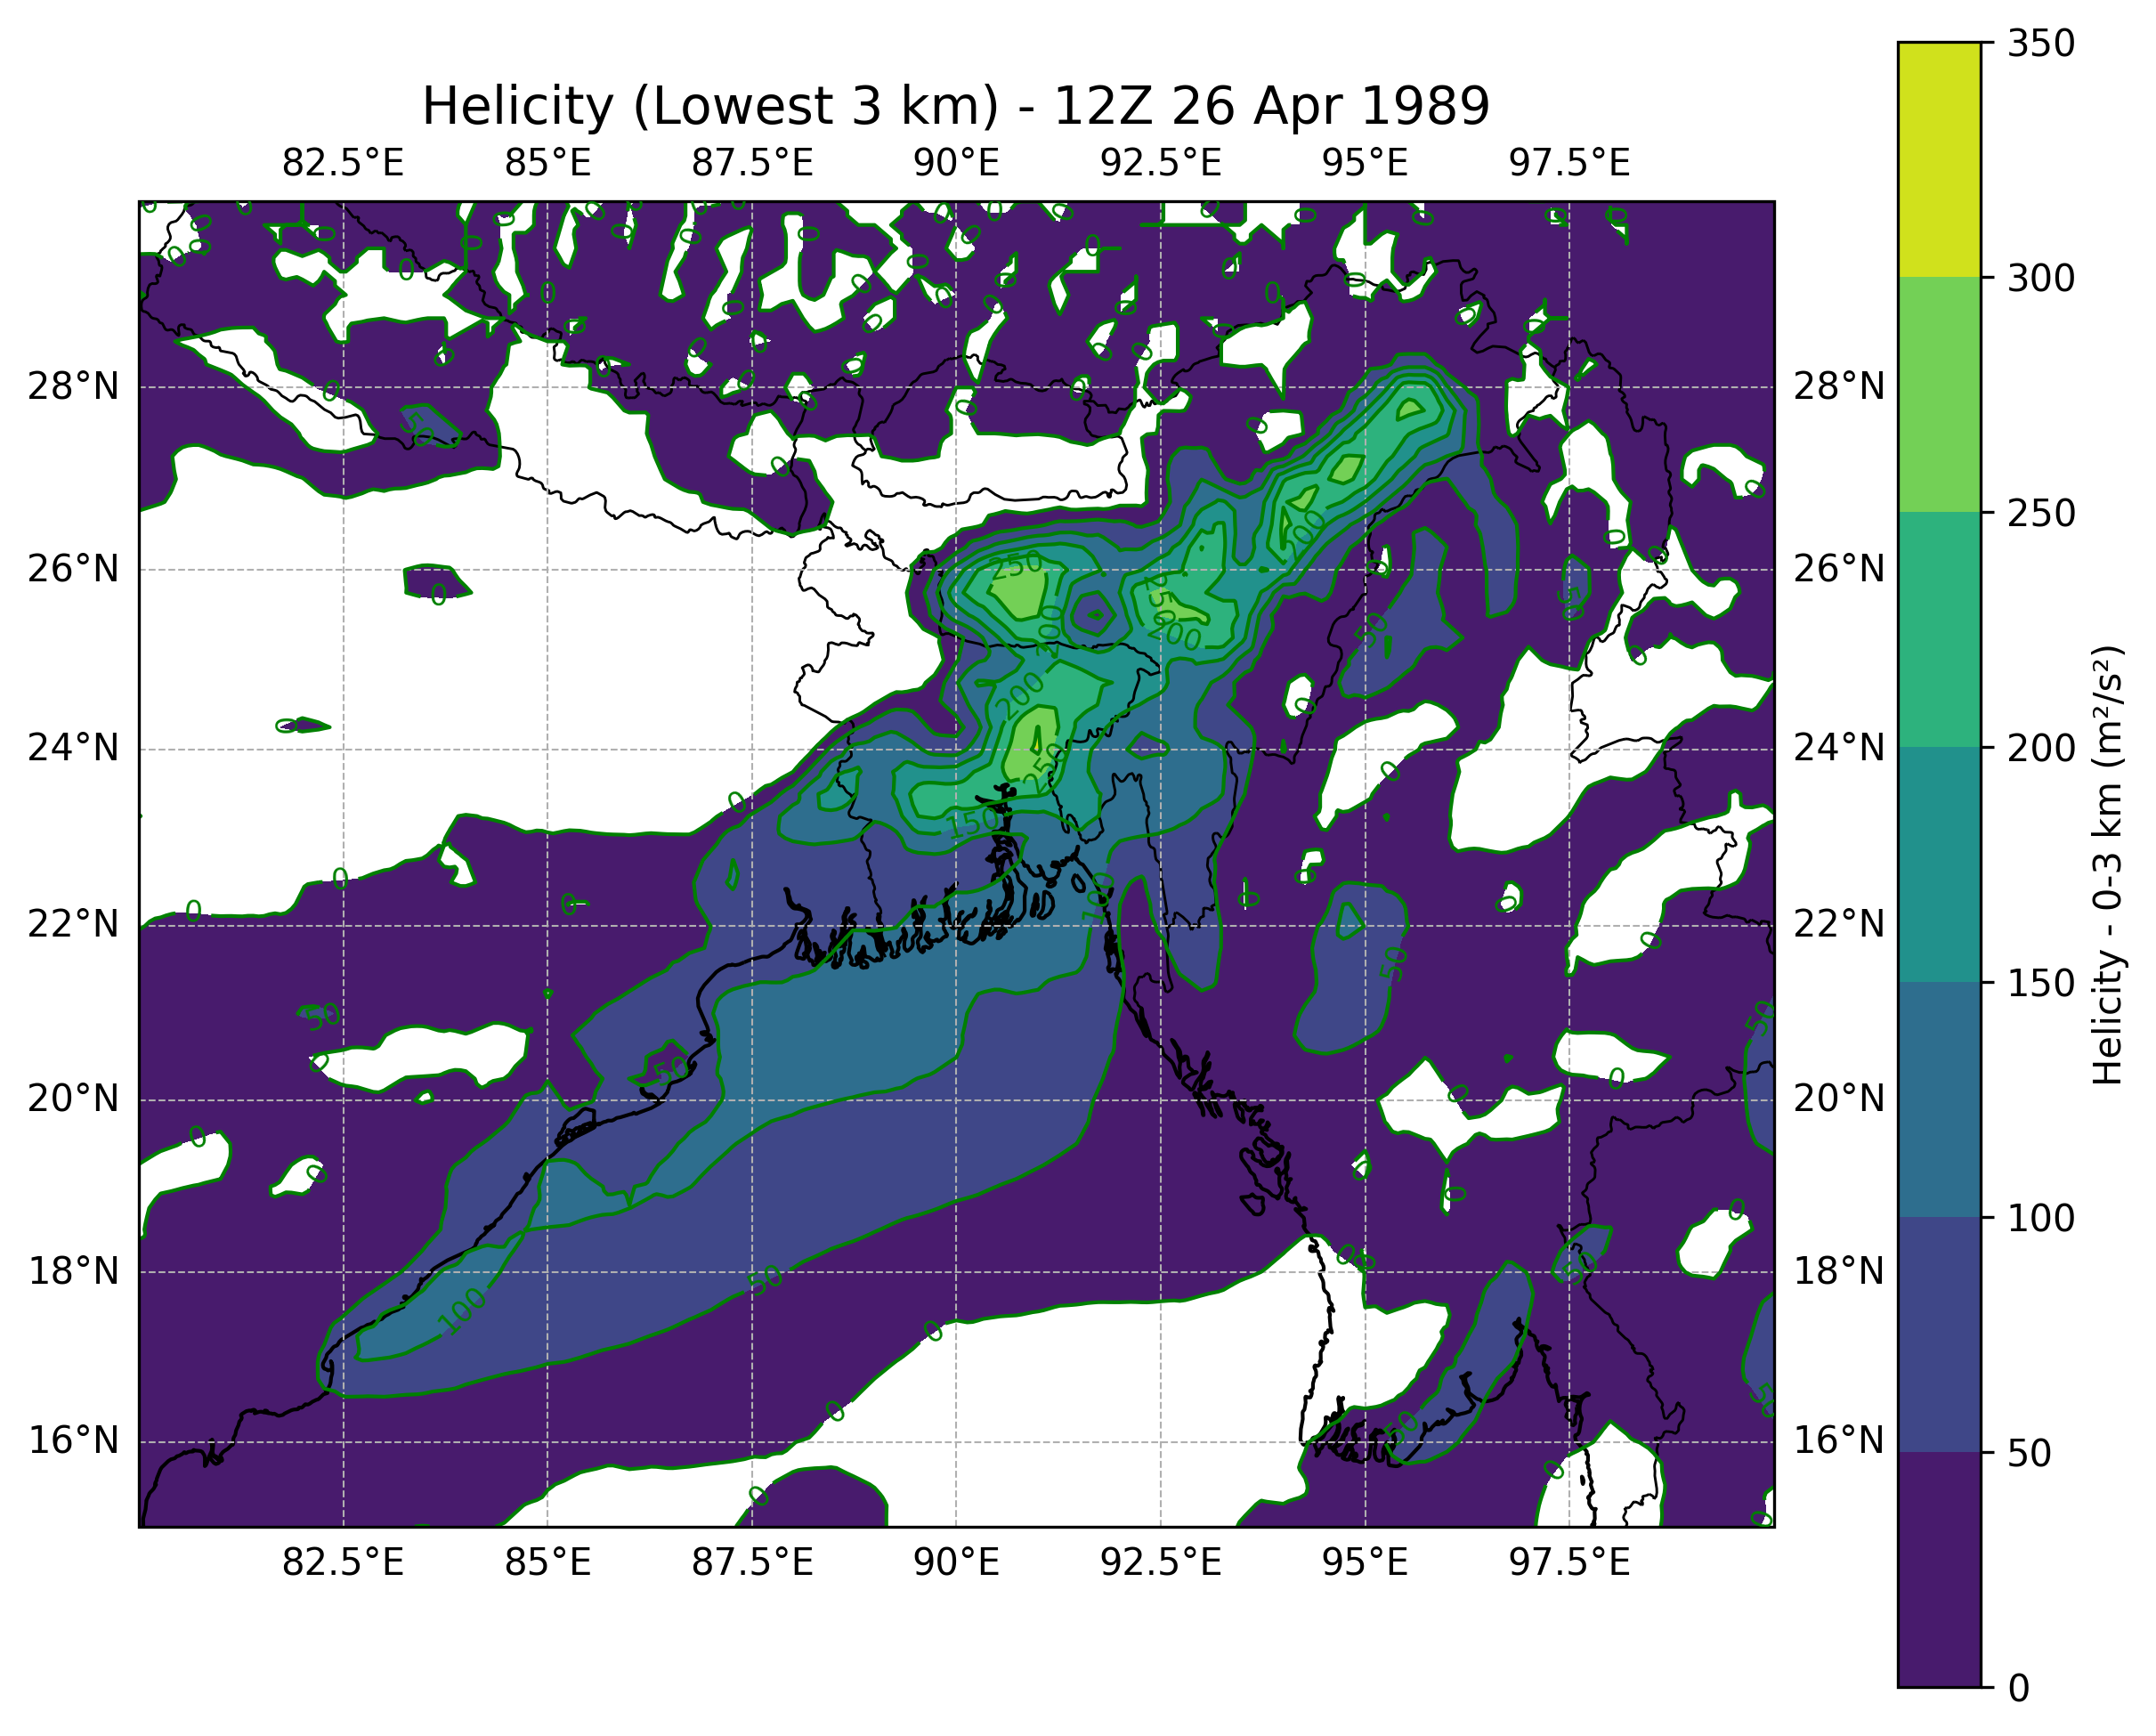
Helicity is a measure of the potential for tornadogenesis based on the rotation and shear in the air. One can look at various layers typically from the surface to 1 km, 3 km or 6 km (or view the storm relative helicity and incorporate storm movement). Above is the most commonly viewed layer, the surface to 3 km helicity, and values greater than around 250 m
Those are some of the important graphics to share (though one could produce tens, if not hundreds of graphics to analyze this further from reanalysis or other means). The important things are combination of the strong westerly winds aloft (including with the jet stream) creating the directional shear due to the low-level south winds, the low pressure center and associated dry line, plus a great amount of instability and moisture. Bangladesh is very much a country prone to severe weather due to its geography, from the Bay of Bengal (which also brings tropical cyclones, some of which are devastating) to the Himalayas which direct some of the weather features (like the jet stream) into that country, and the very high population density combined with a low standard of living results in a large number of people who are highly vulnerable to the weather.
Come back soon for analyses of weather and climate, anywhere from California to other parts of the US to around the world!
Some of the future topics will include:
The wettest atmospheres in the world (based on "precipitable water")
Timberlines (highest elevation that trees can grow in a mountain range) and climate
Maximum precipitation rates reported given a certain temperature
Ways for anyone to get "strange" climate data online
Case studies of unusual storms