
Periodic analyses of weather and climate will be posted here, with links to previous editions at the bottom. Remember to click on the image if you need to zoom in (especially important in this blog entry!).
Welcome to summer! Since the summer solstice was this past Sunday in the Northern Hemisphere, I thought it would be good to look at something that most people don't think about often with summer. Record cold. Granted, all-time July low temperatures are nowhere close to all-time December or January low temperatures, but there have been some chilly periods in the past. (Yes--there's a big heat wave currently in western Europe, and I plan to have some info here about that after the event concludes.)
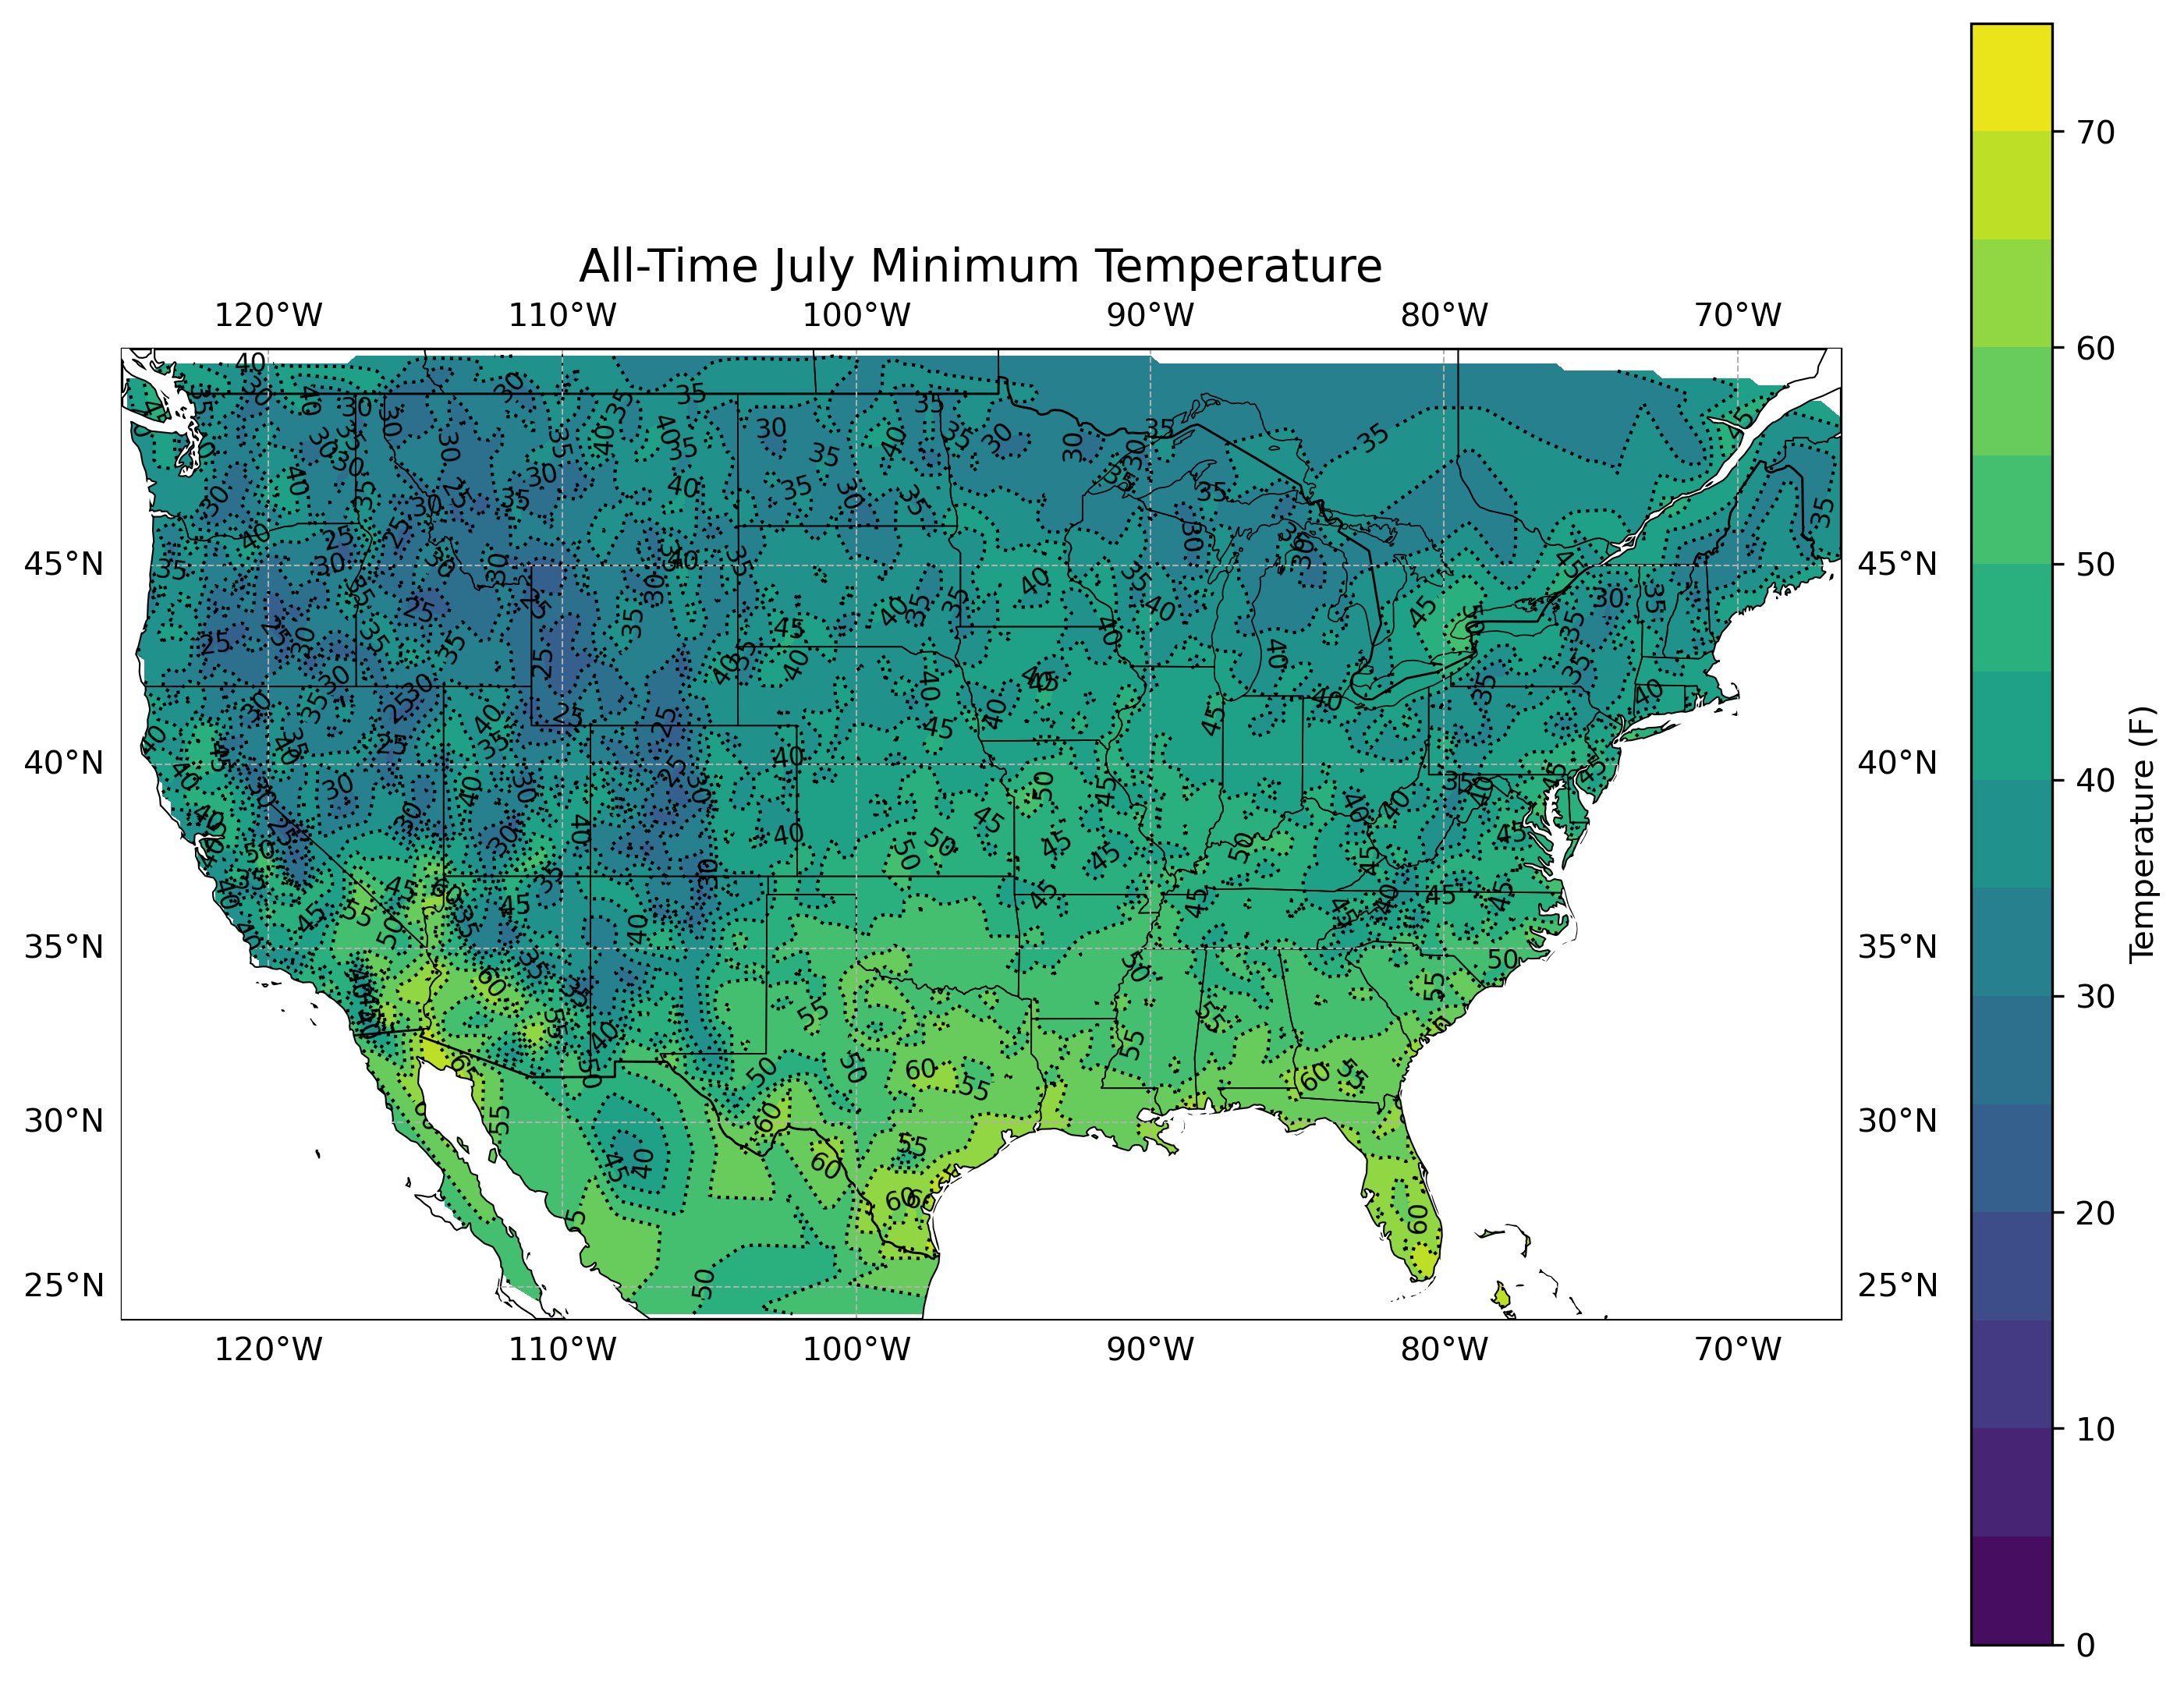
First, let's look at a couple of maps showing the lowest temperatures ever recorded in July. The first one will be a contour map:
The second one will have the actual values (so you'll need to click to zoom in):
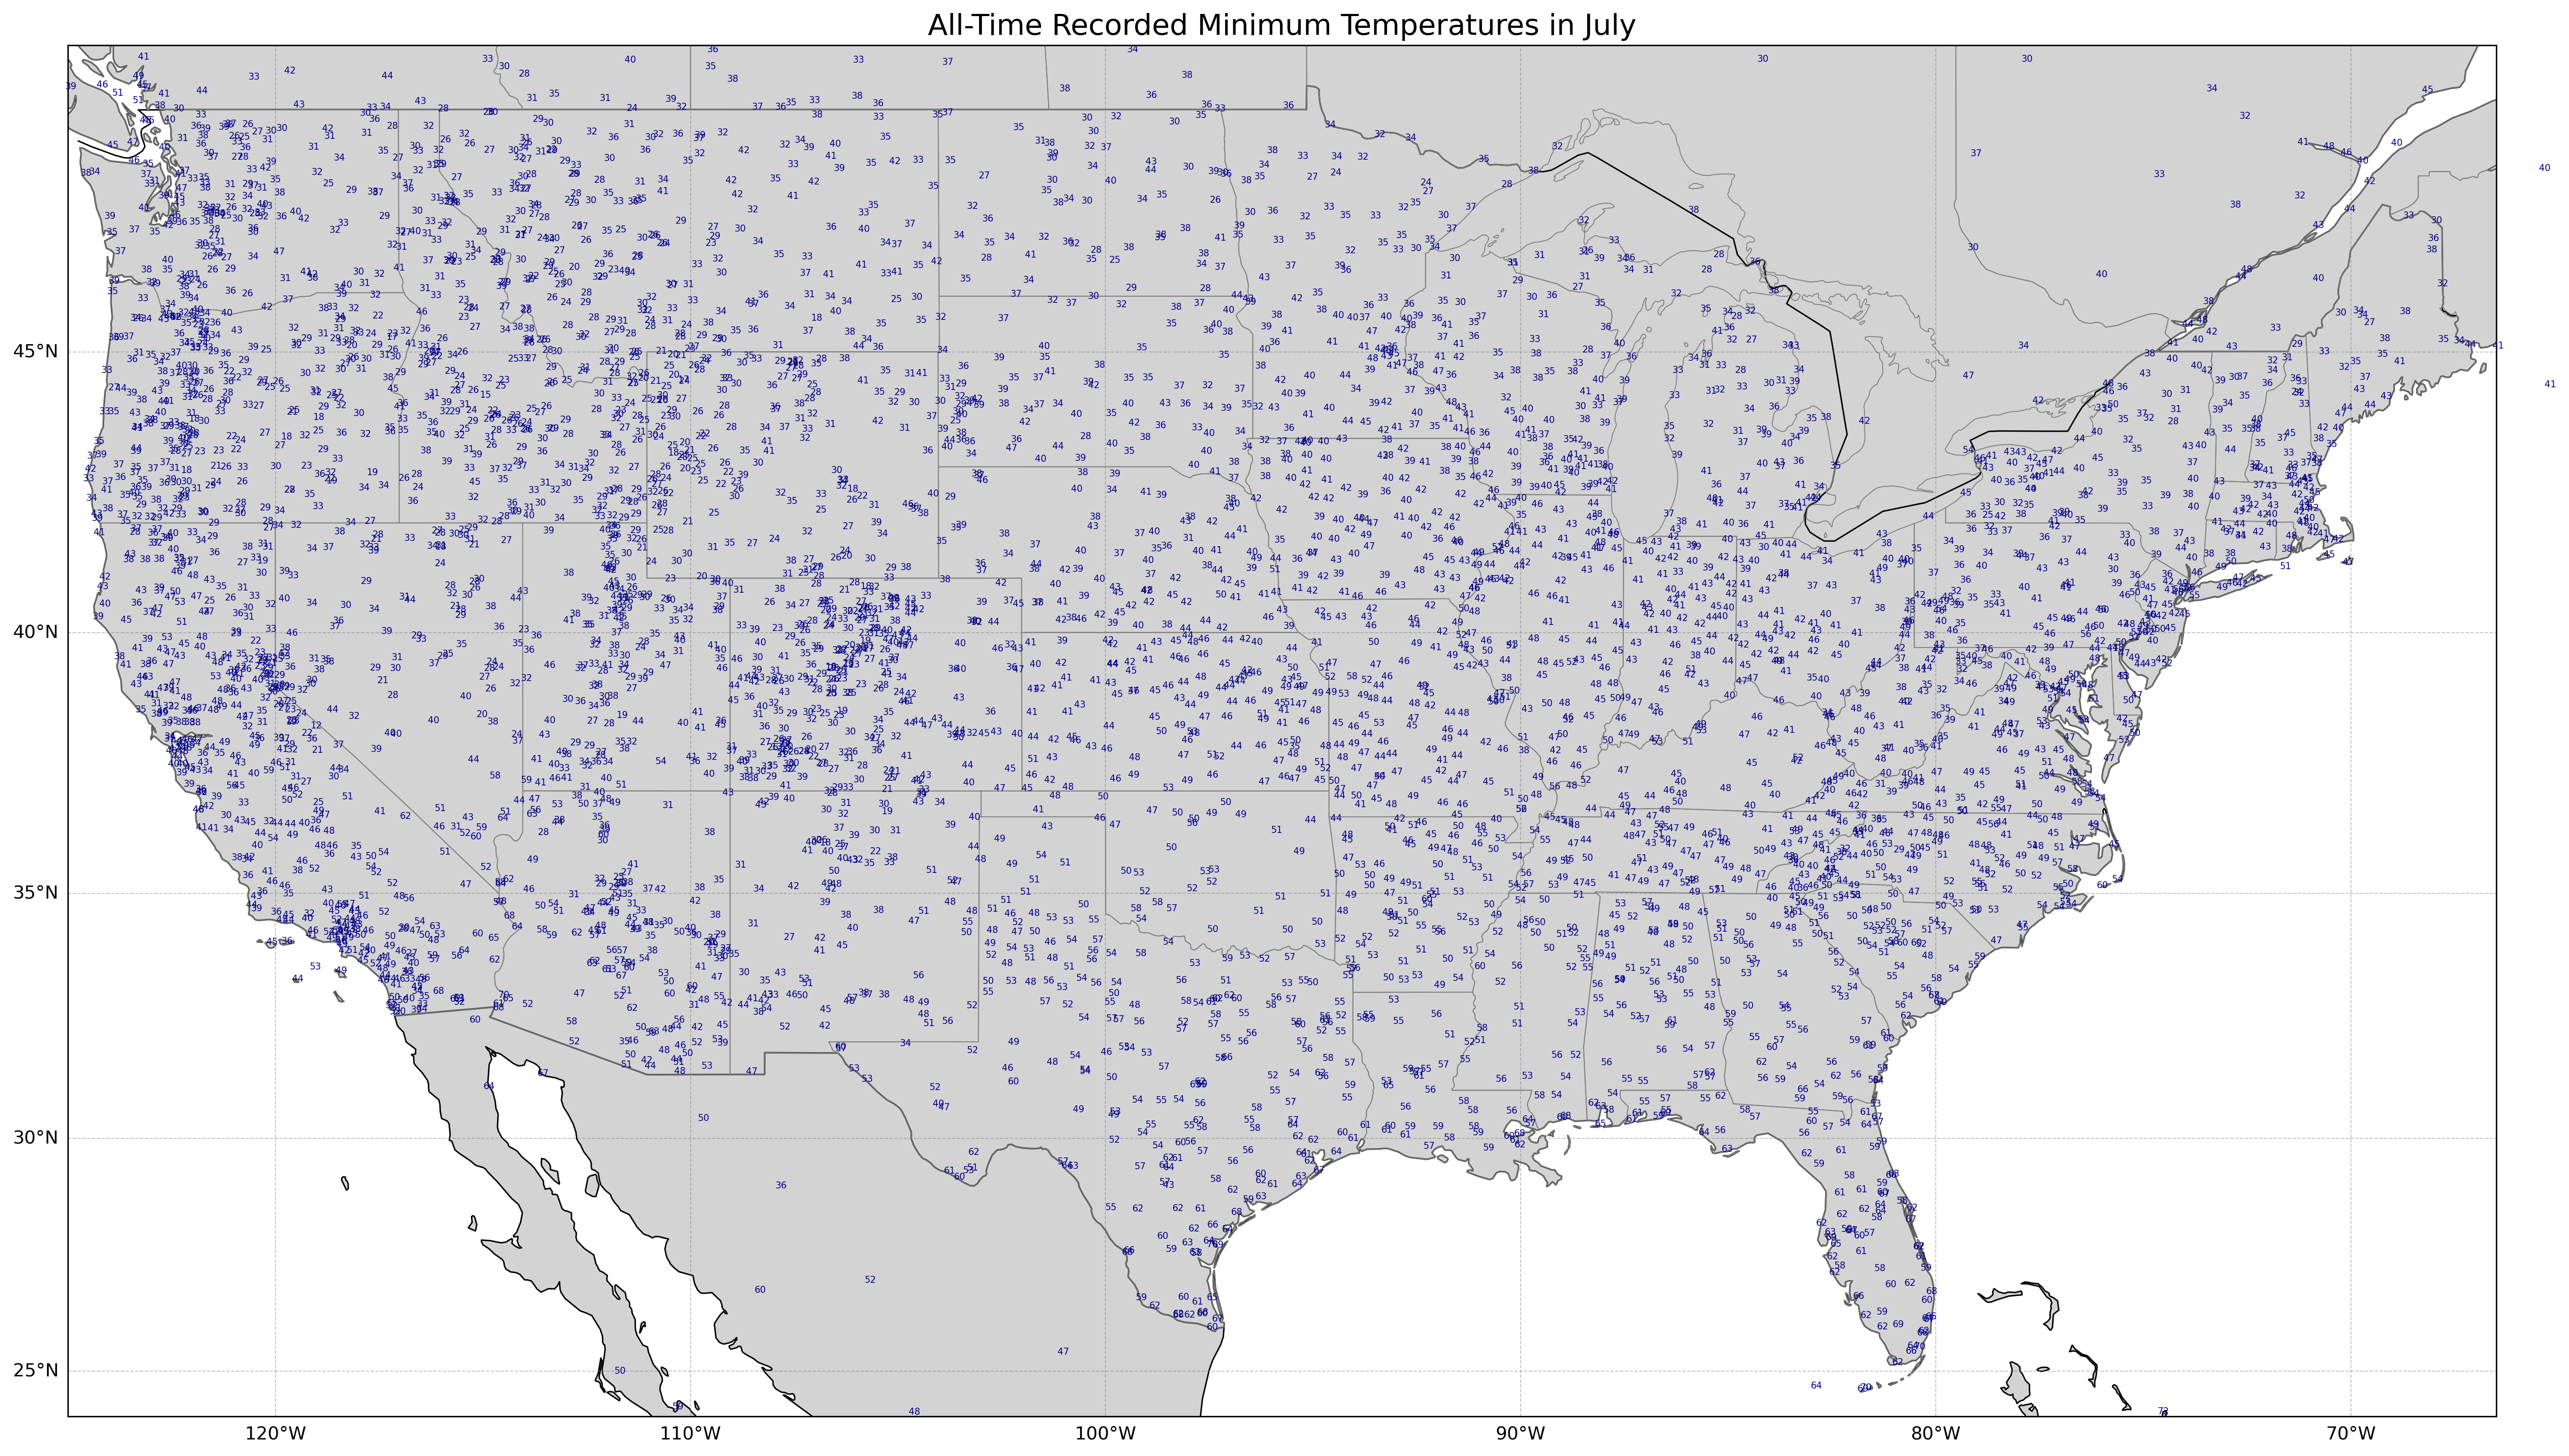
As you can see, most of the United States can have cool spells in summer, though in most cases not very frequently. Many parts of the Intermountain West can get near or below freezing, as well as the northern tier of states. Even most of the central US and Mid-Atlantic can have lows in the 40s, and only the Deep South, a few areas of central and southern Texas and lower parts of the Desert Southwest have failed to get below 60 in July during at least the period of record. Next, let's look at the years when all-time record low July temperatures occurred.
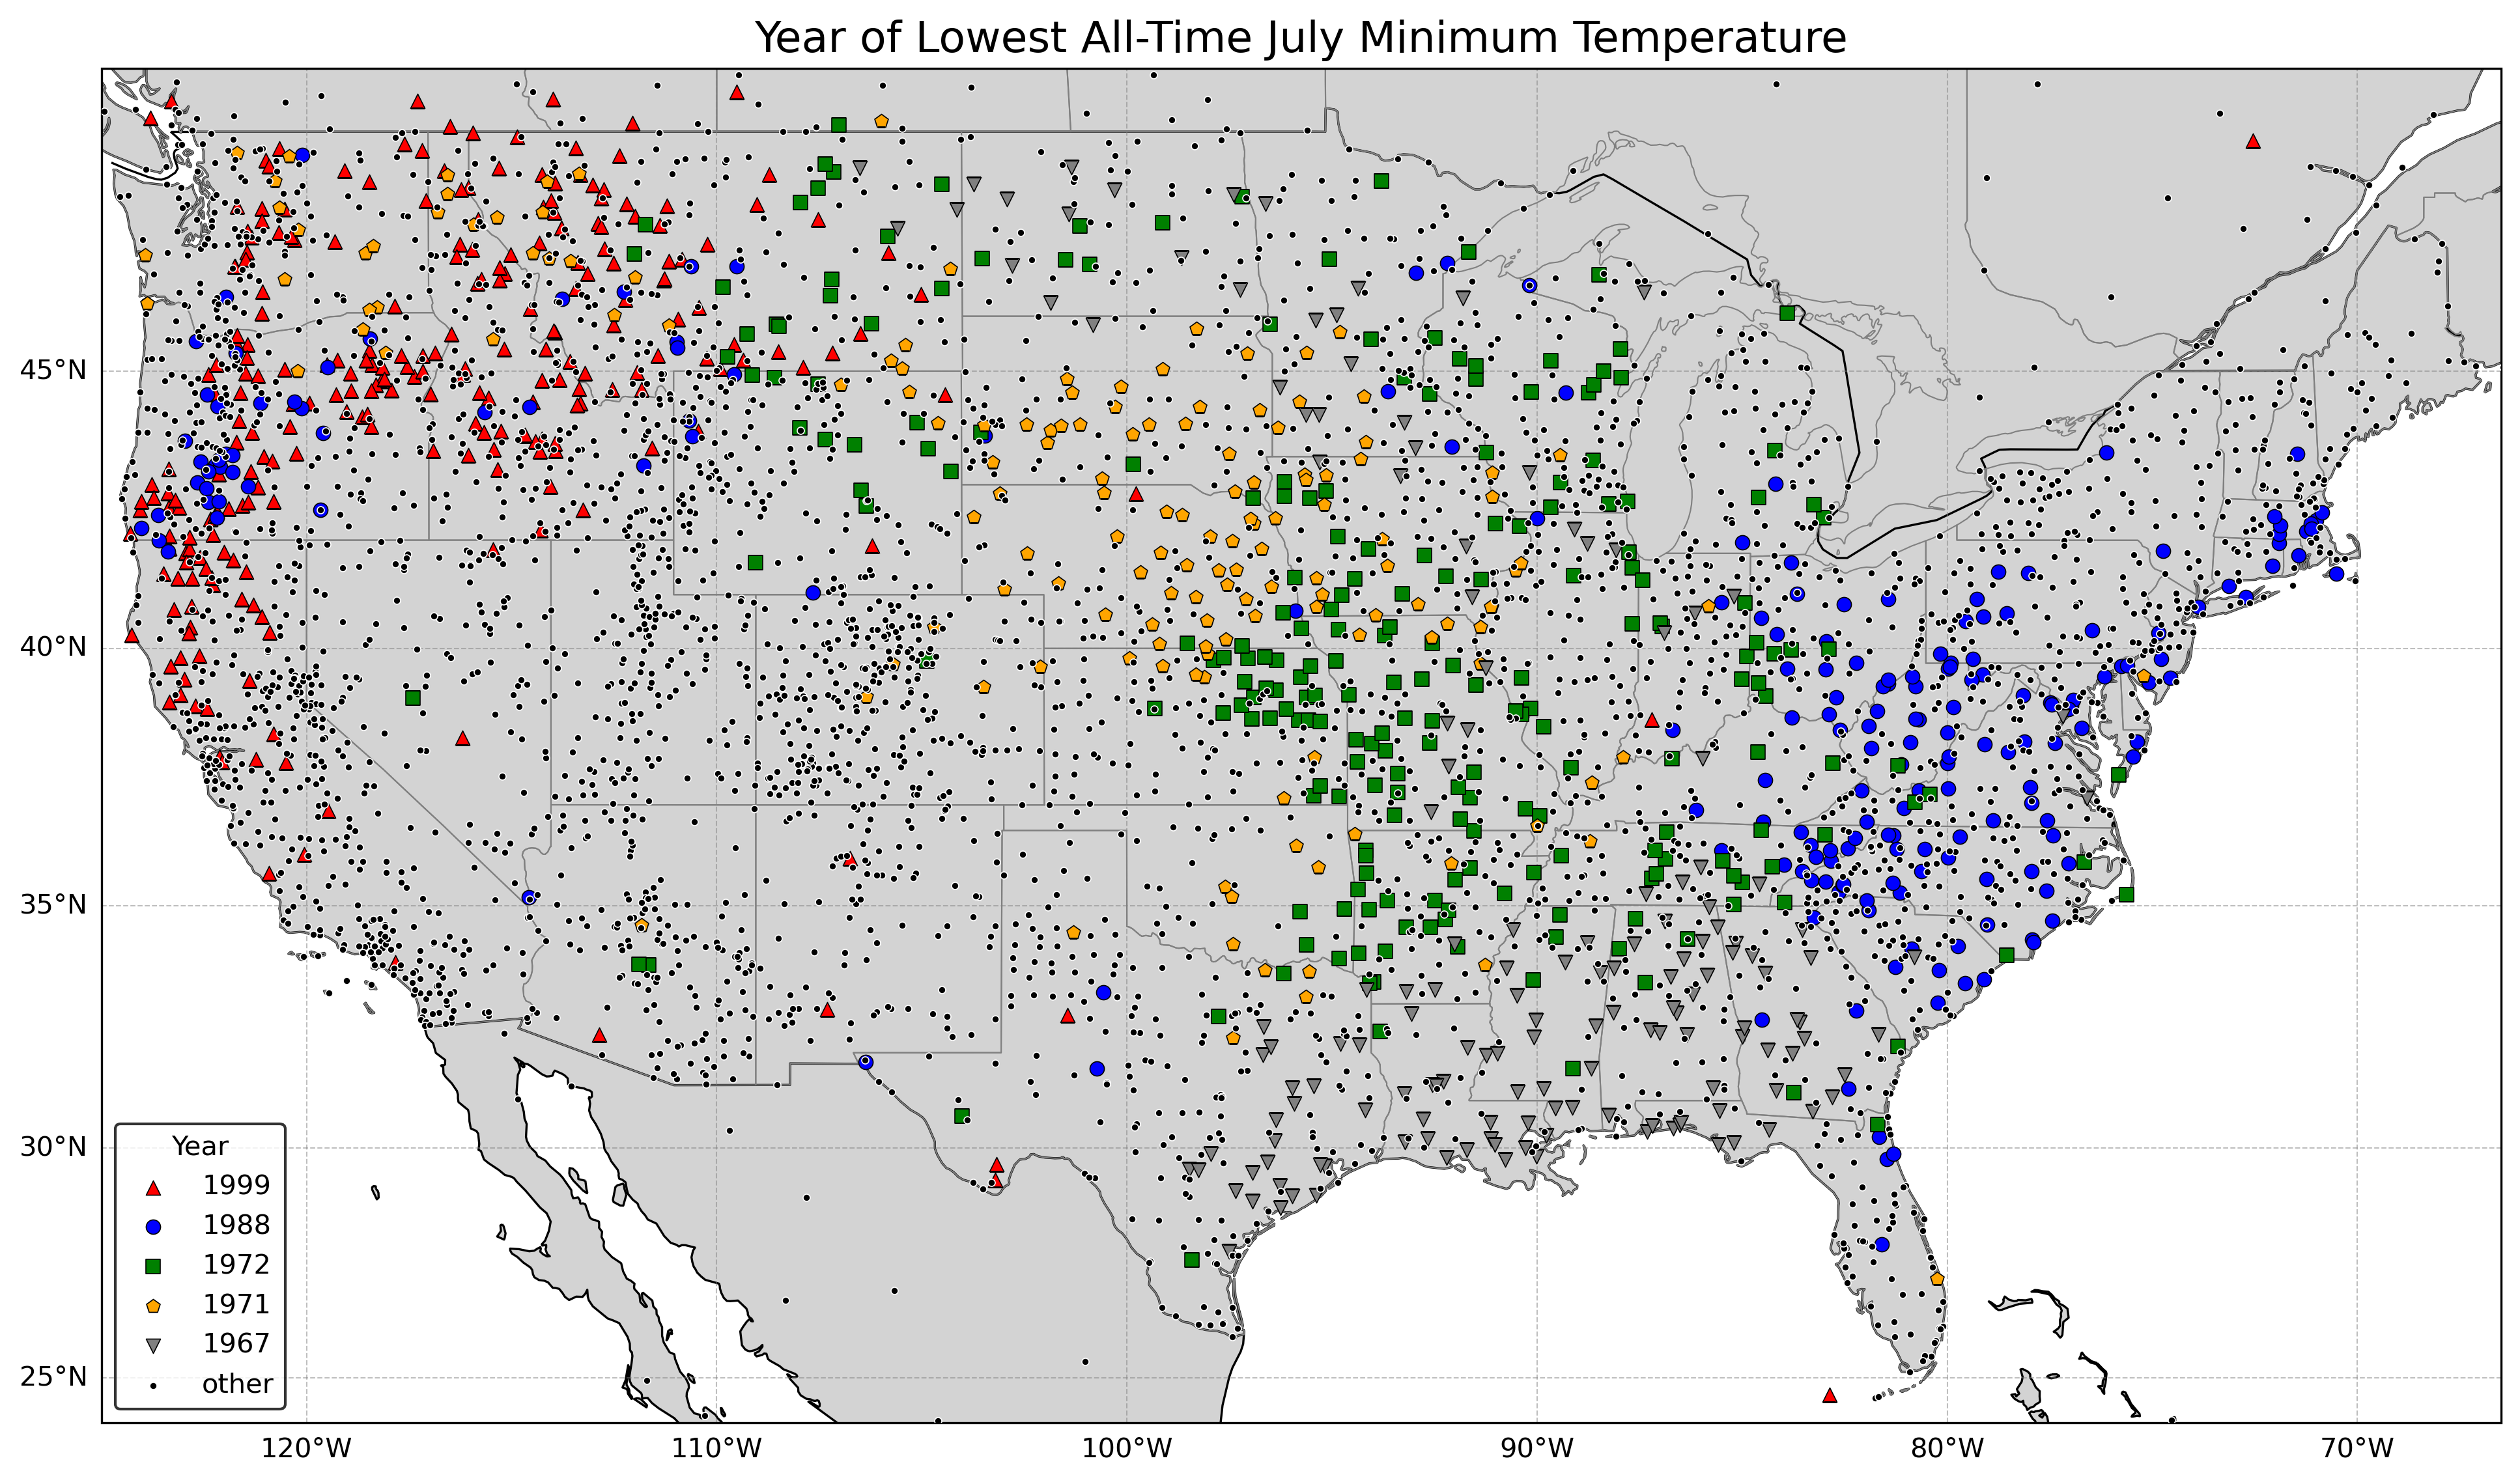
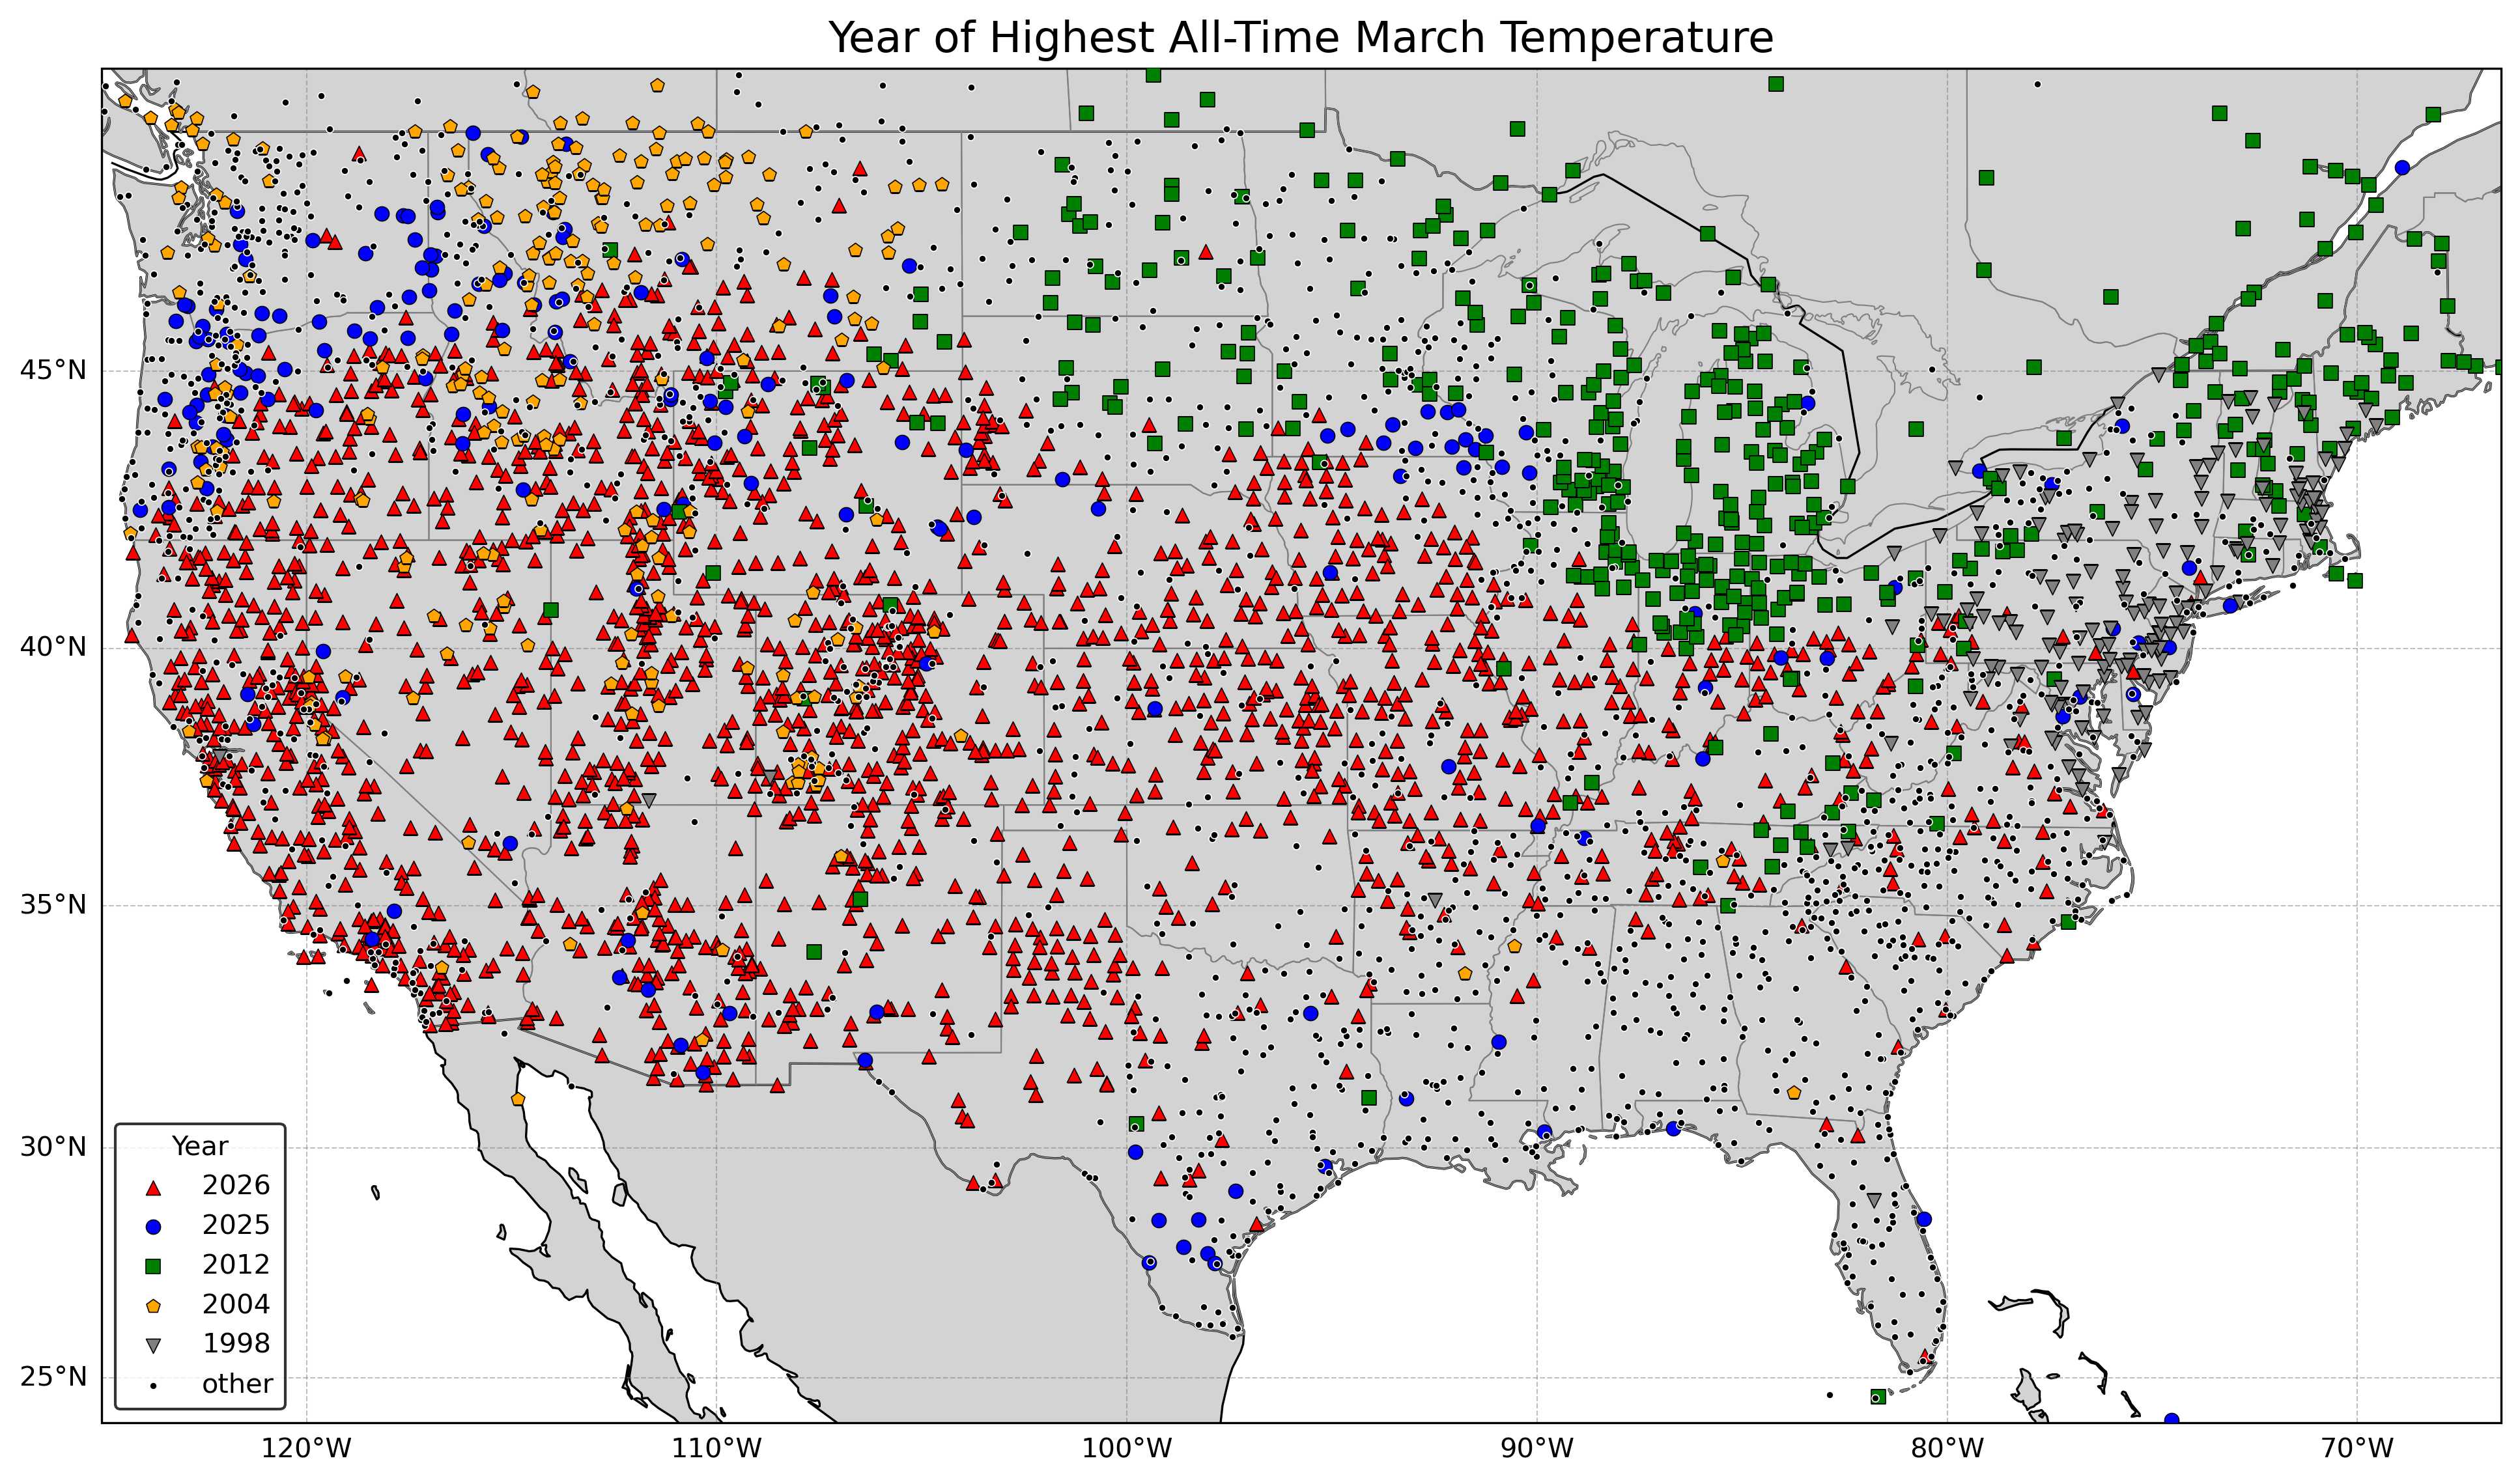
Compare that with the map below showing the year of all-time record highs in March, and you can see that all-time record lows in July are not as widespread during any particular year as record highs. That is because heat waves are associated with broad high pressure aloft, often associated with drought, though that's most frequently the case in summer (March 2026 was clearly unusual for so early in the year, see for more). In summer, cool/cold spells are not typically as widespread as the heat waves (winter is a different story as it is easier for cold air mass to be expansive then).
The top five years for record low temperatures in July are as follows (only including stations with at least 30 years of data, and not including Snotel stations given a large number of bad values in the 1980s--too bad since many of the Snotel stations are remote and at high elevations):
Rank       Year         Number of All-Time July
                        Record Low Temperatures

1.         1972                  233
2.         1988                  192
3.         1967                  159
4.         1971                  156
5.         1999                  148

All other years                 3200
Note that there were relatively few stations before the 1940s, so no older years came even close.
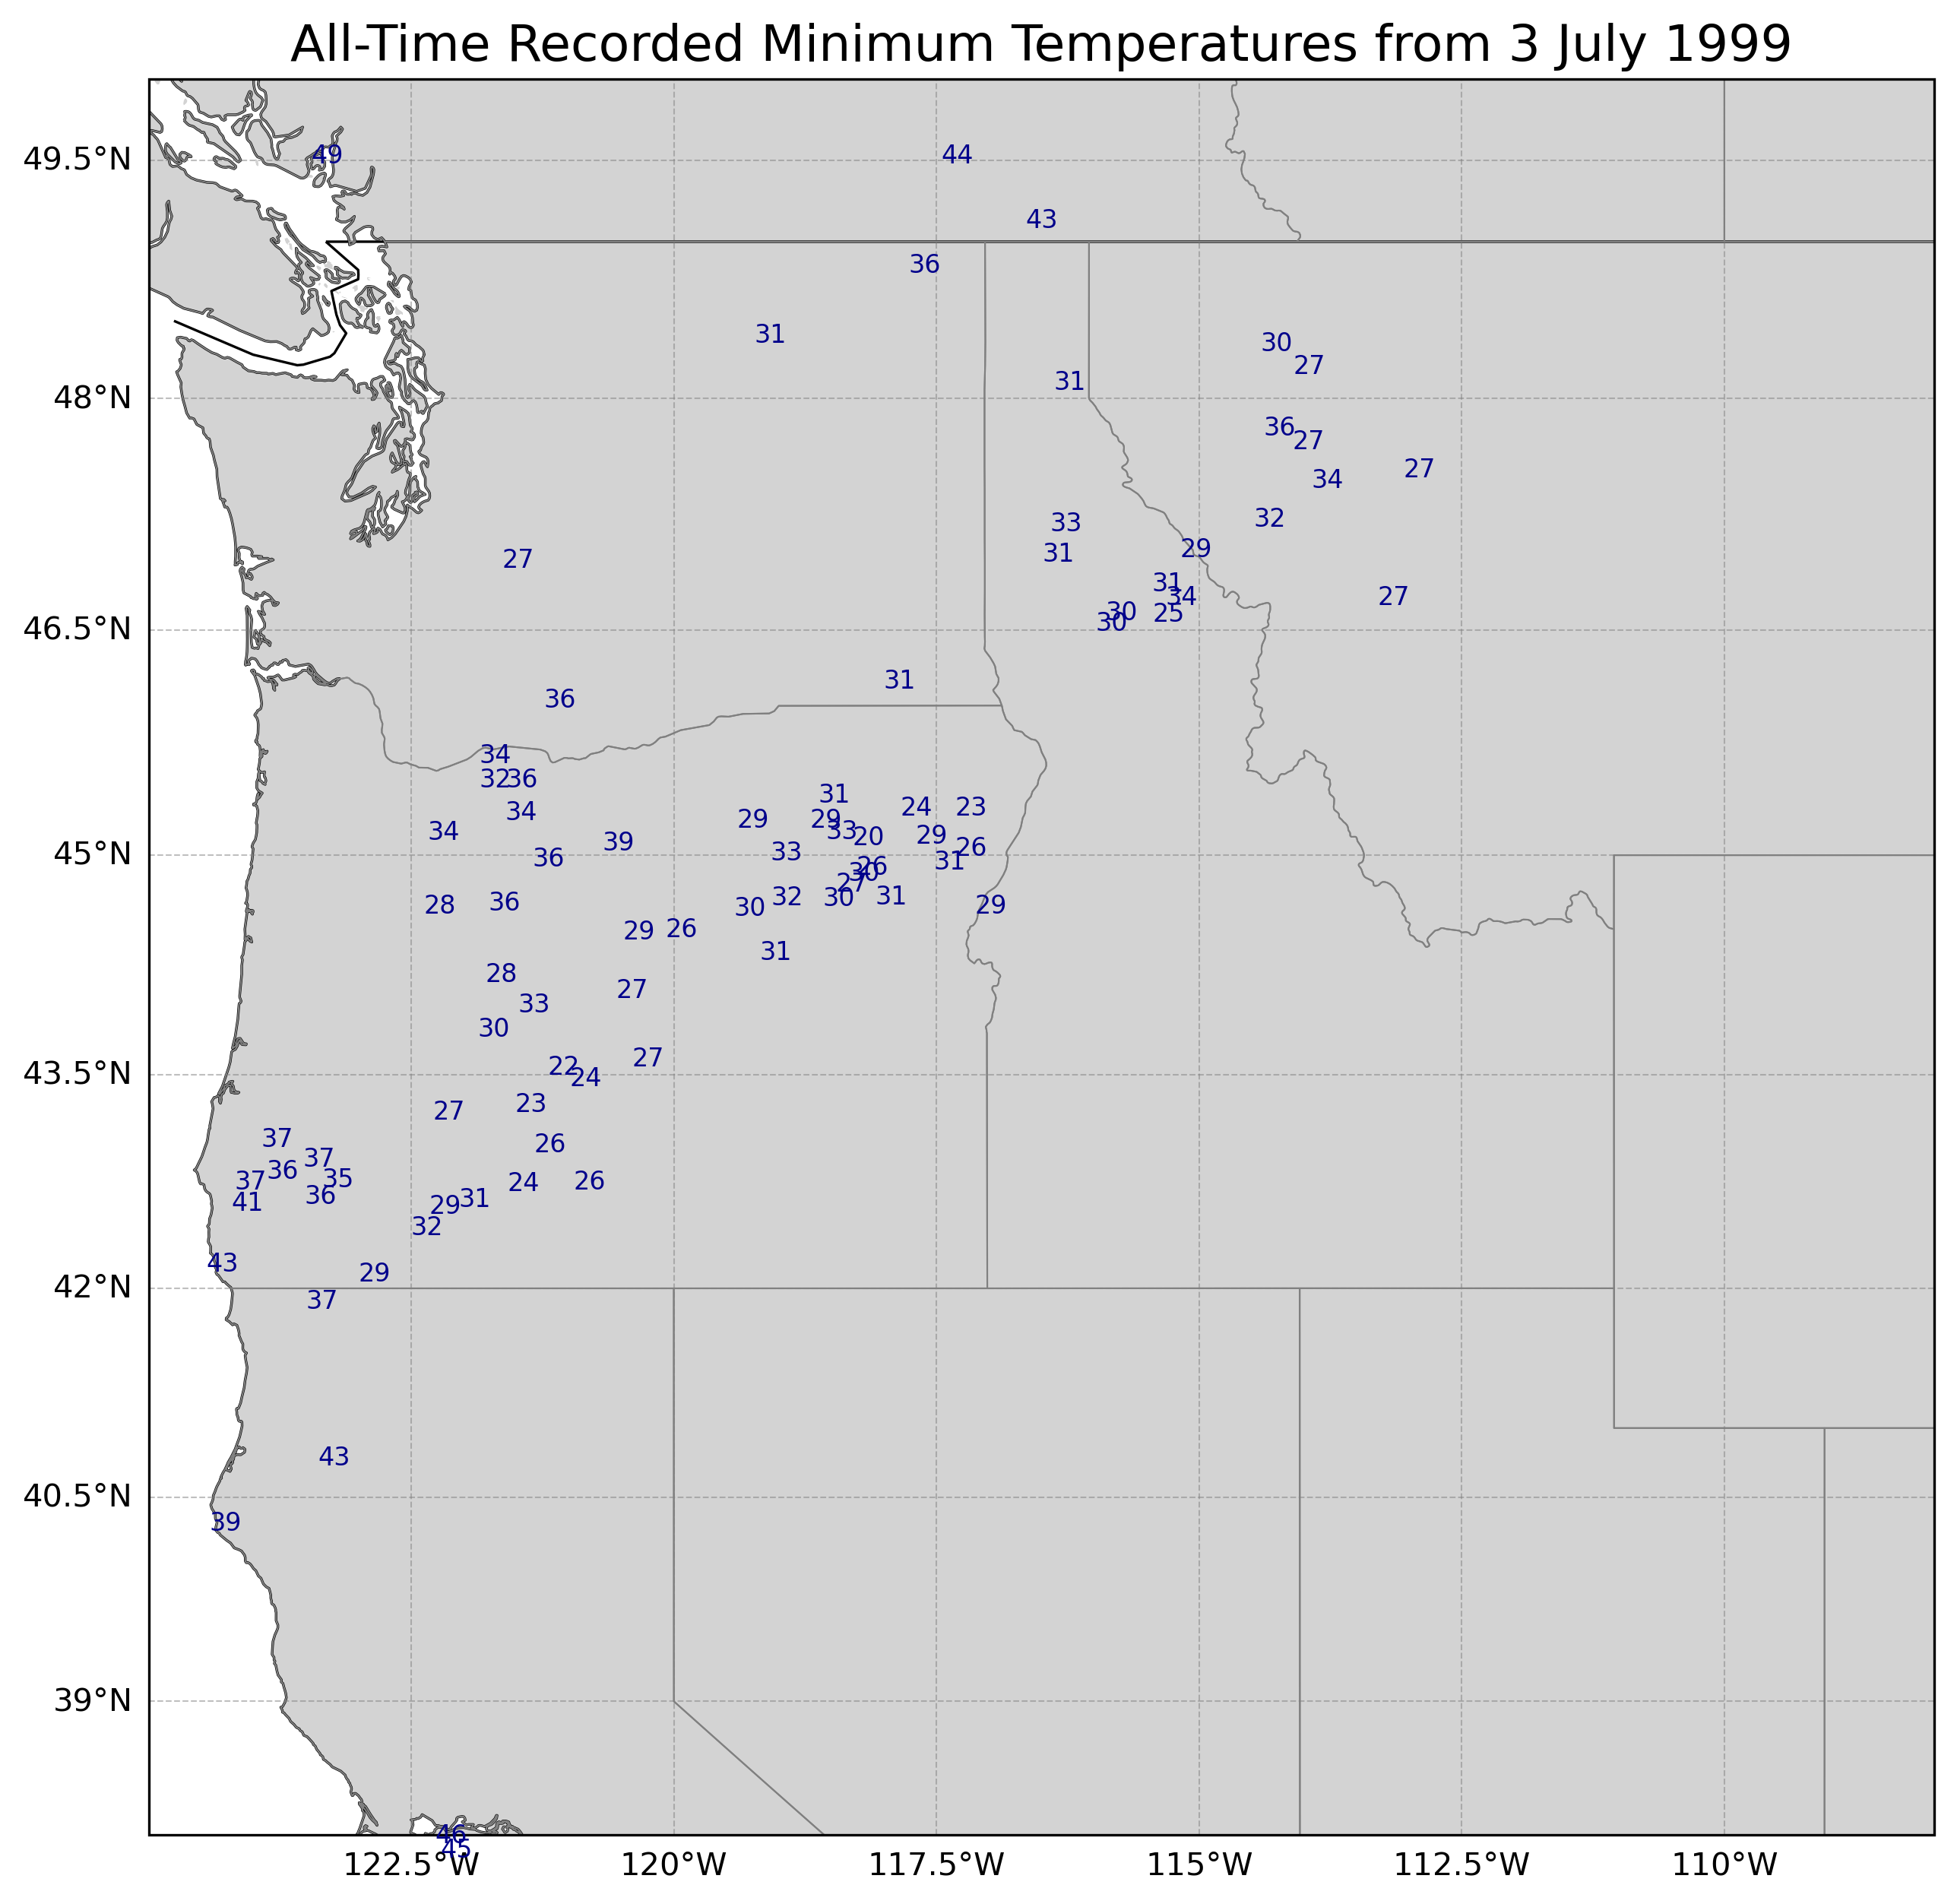
Let's first look at the most recent year, 1999. 3 Jul 1999 had the most all-time record low temperatures of that month with 85 (of the 148 total in July). Here's a map of those lows (including quite a lot of 20s in generally more remote mountainous areas from Oregon to Idaho):
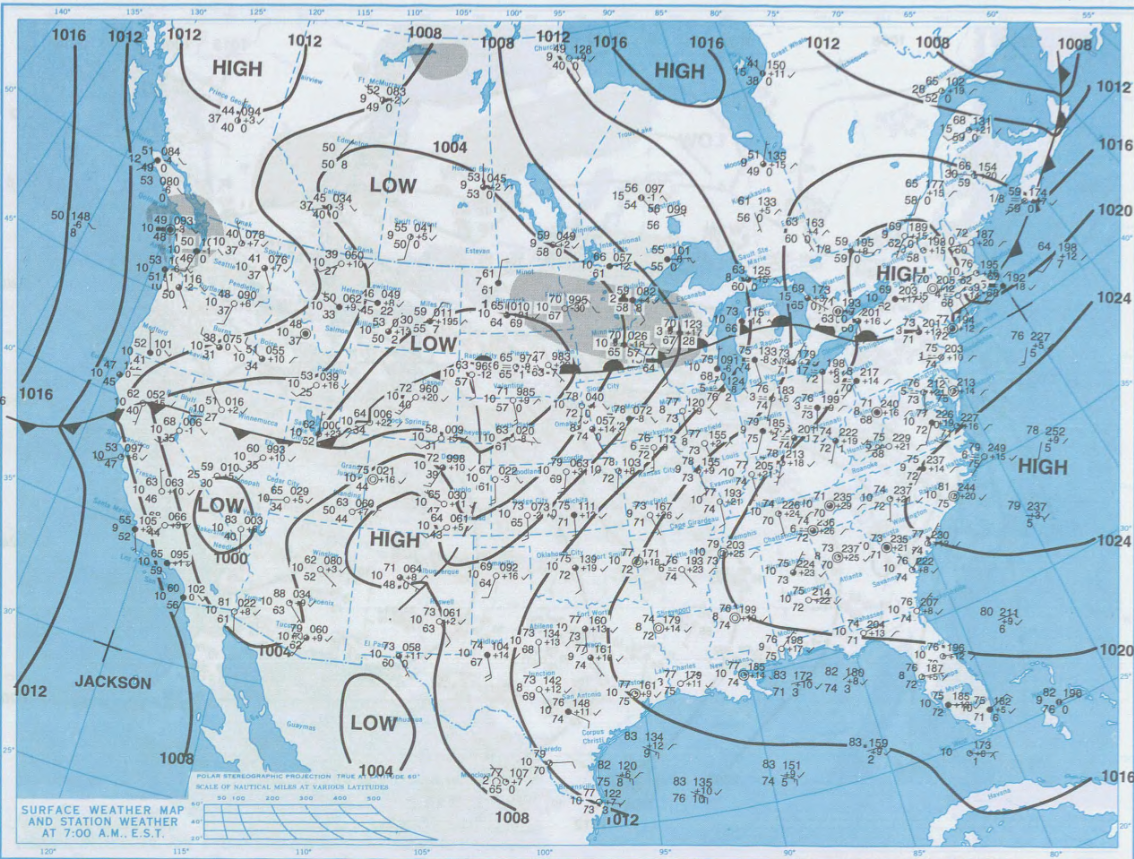
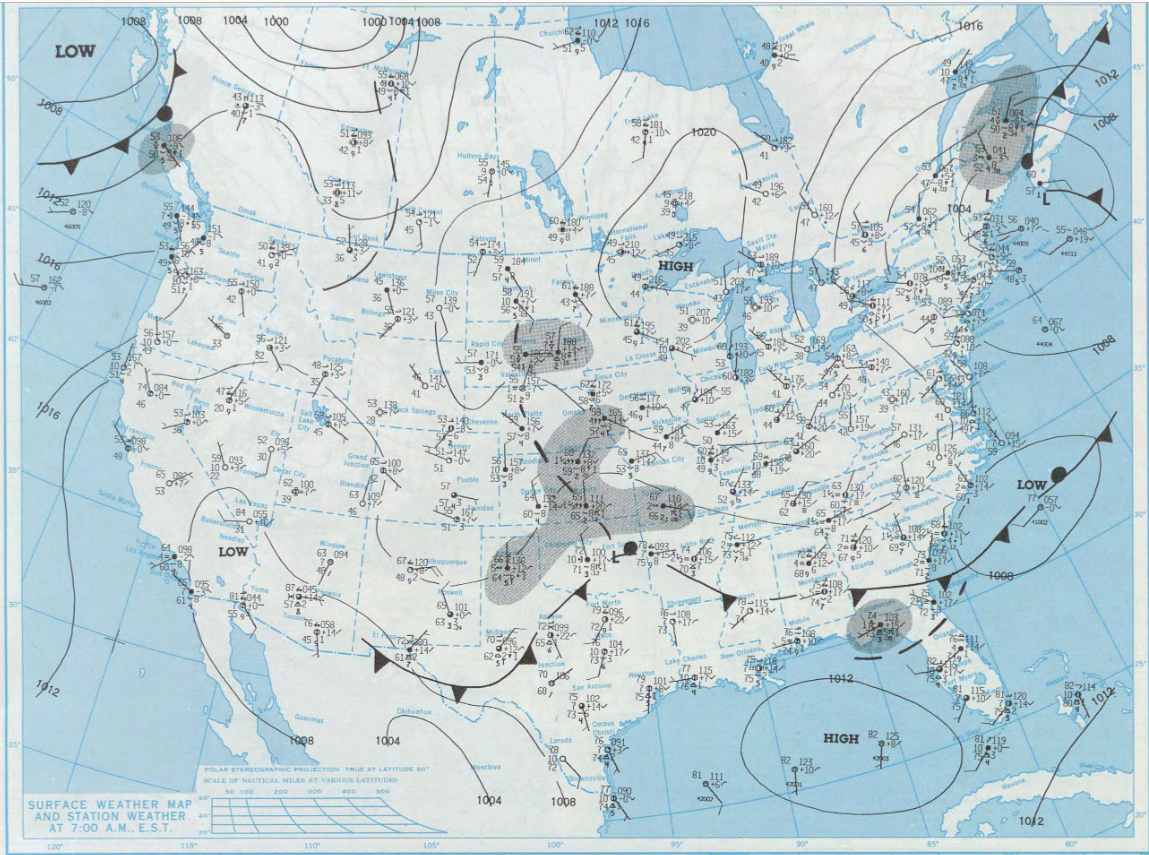
From the NOAA/NWS/NCEP Daily Weather Maps archive website, we will look at an image that shows the surface data (from the morning of 3 July). There was a well-defined cold front separating the seasonally hot air mass to the south and especially southeast versus an unseasonably cool air mass to the northwest.
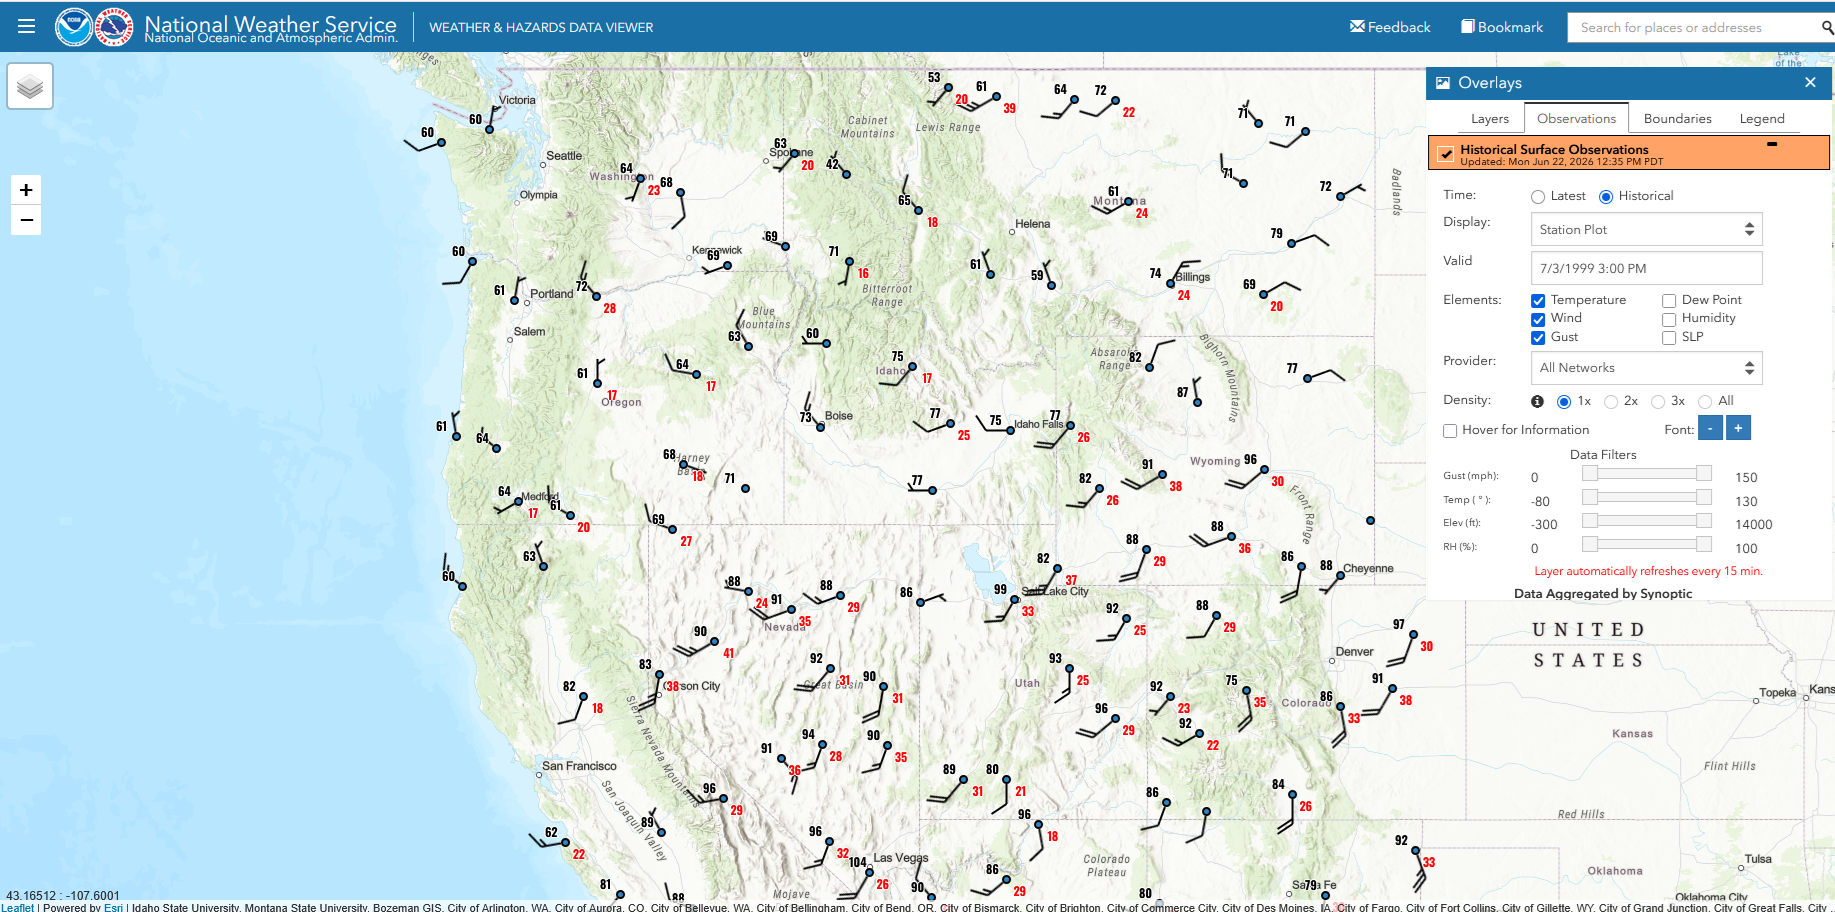
Fast forward to that afternoon (3 PM PDT/4 PM MDT), the front continues to highlight the differences (99 F/37 C in Salt Lake City, Utah, 75 F/24 C not far to the north in Idaho Falls, Idaho, and only 42 F/6 C at Mullan Pass, Idaho, at 6000 feet/1800 meters elevation).
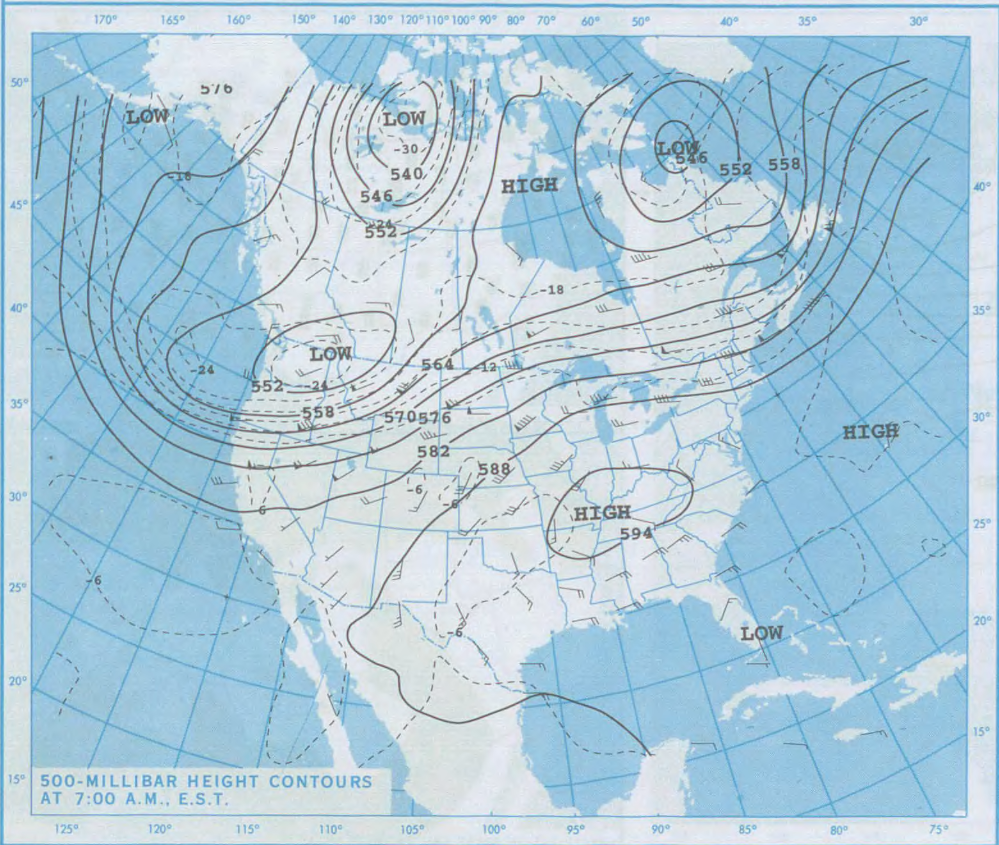
Looking at 500 hPa heights, there is a strong trough over the northwestern US with a connection to a polar low. According to the ERA5 reanalysis (not shown here), some of the areas under the trough had their lowest July 500 hPa heights in the history of that reanalysis (1940 to 2025), which is typically a sign of a cold air mass (this was the case here), or if not, then a strong storm with low pressure both at the surface and aloft.
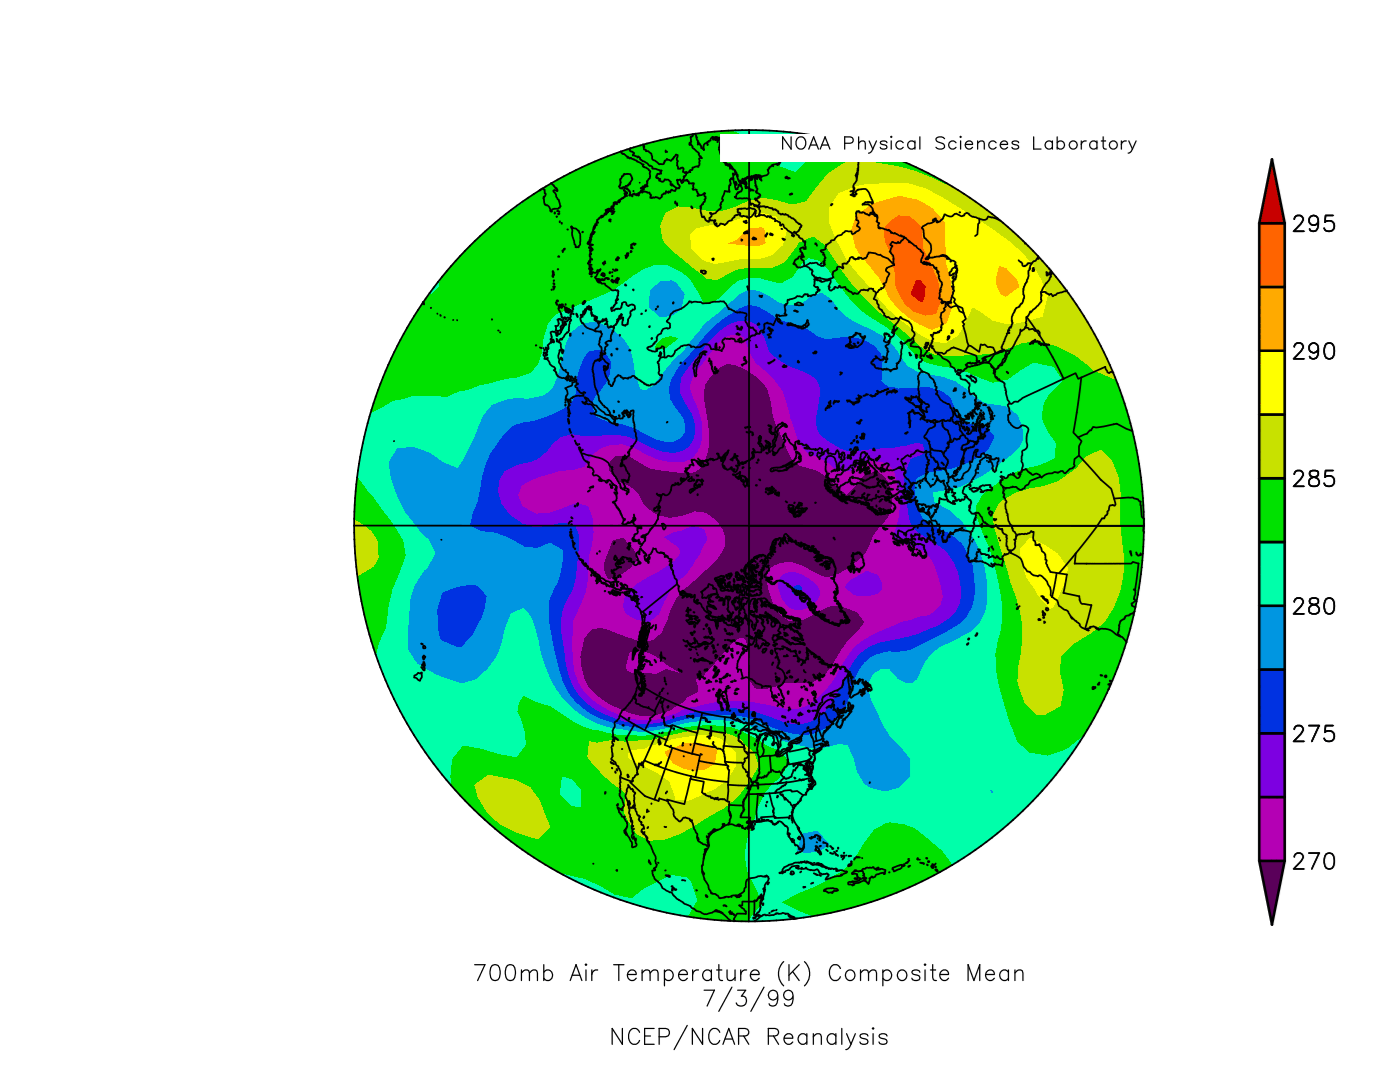
Next, we will use the NOAA Physical Sciences Laboratory (PSL) Daily Mean Composites, which gives us a quick look at the 700 hPa temperatures (generally around 10000 feet/3000 meters above sea level, depending on the weather pattern) which gives us the approximate view of the polar vortex (which is typically defined higher up in the atmosphere). The cold pool over the northwestern United States with temperatures below 270 K (or about 28 F/-3 C) extends all the way to the North Pole (with the other southward extensions elsewhere in the Northern Hemisphere not making it even close to the latitude of the Pacific Northwest):
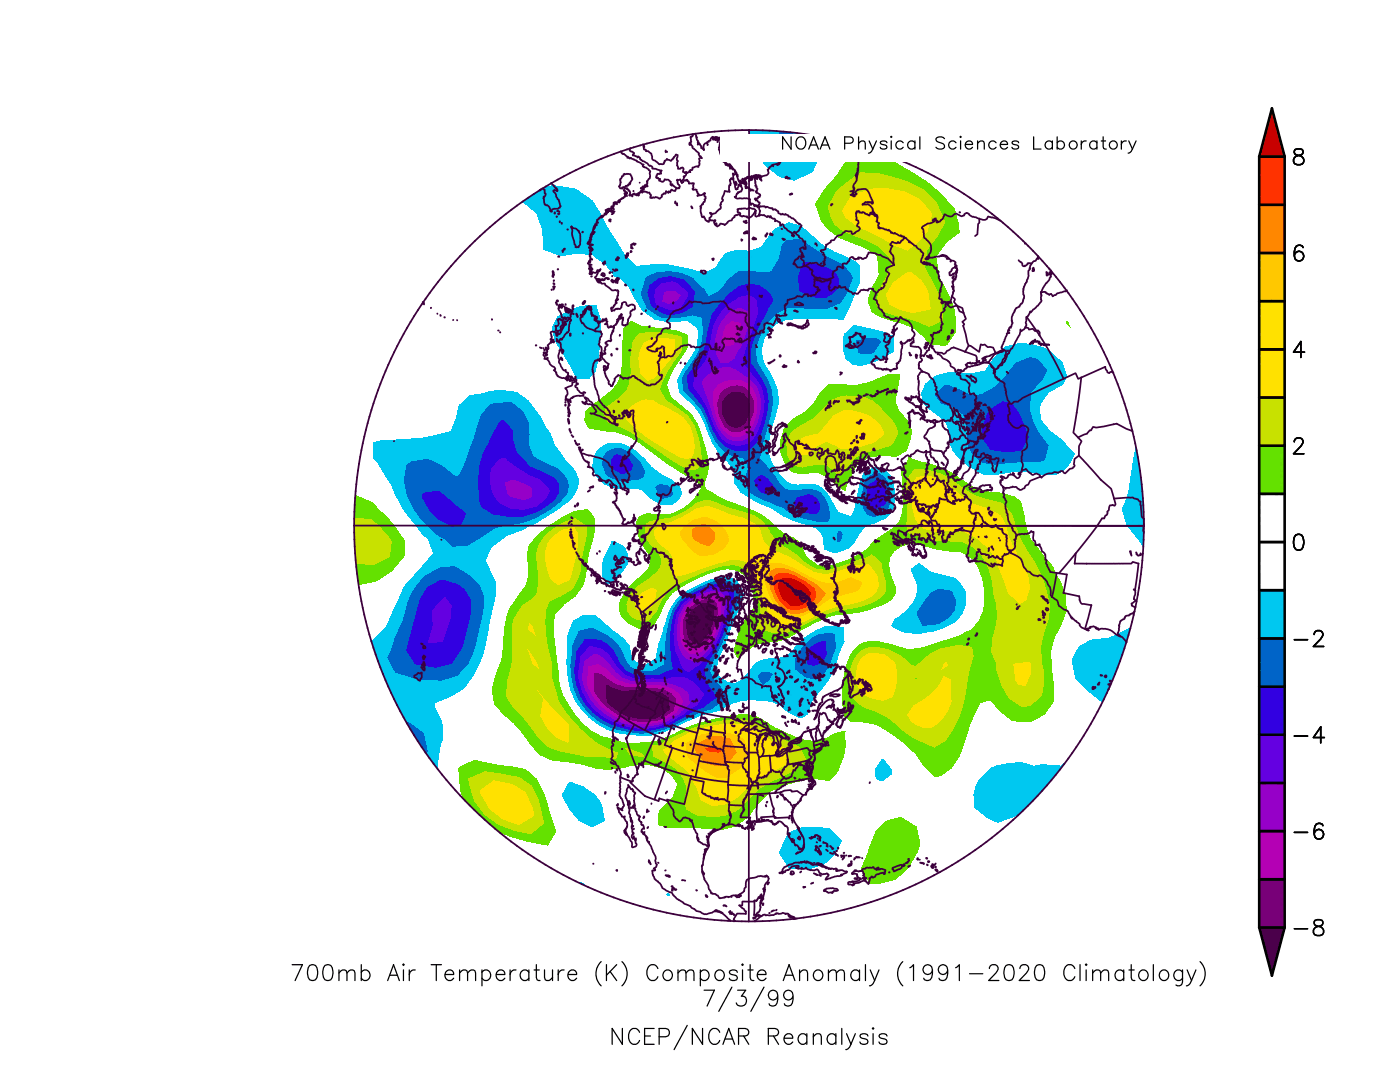
The anomaly map (same 700 hPa temperature) shows temperatures at that level 8 deg C or more below normal, with the only other area with a similar anomaly outside of the United States or Canada being a small area of northern Siberia.
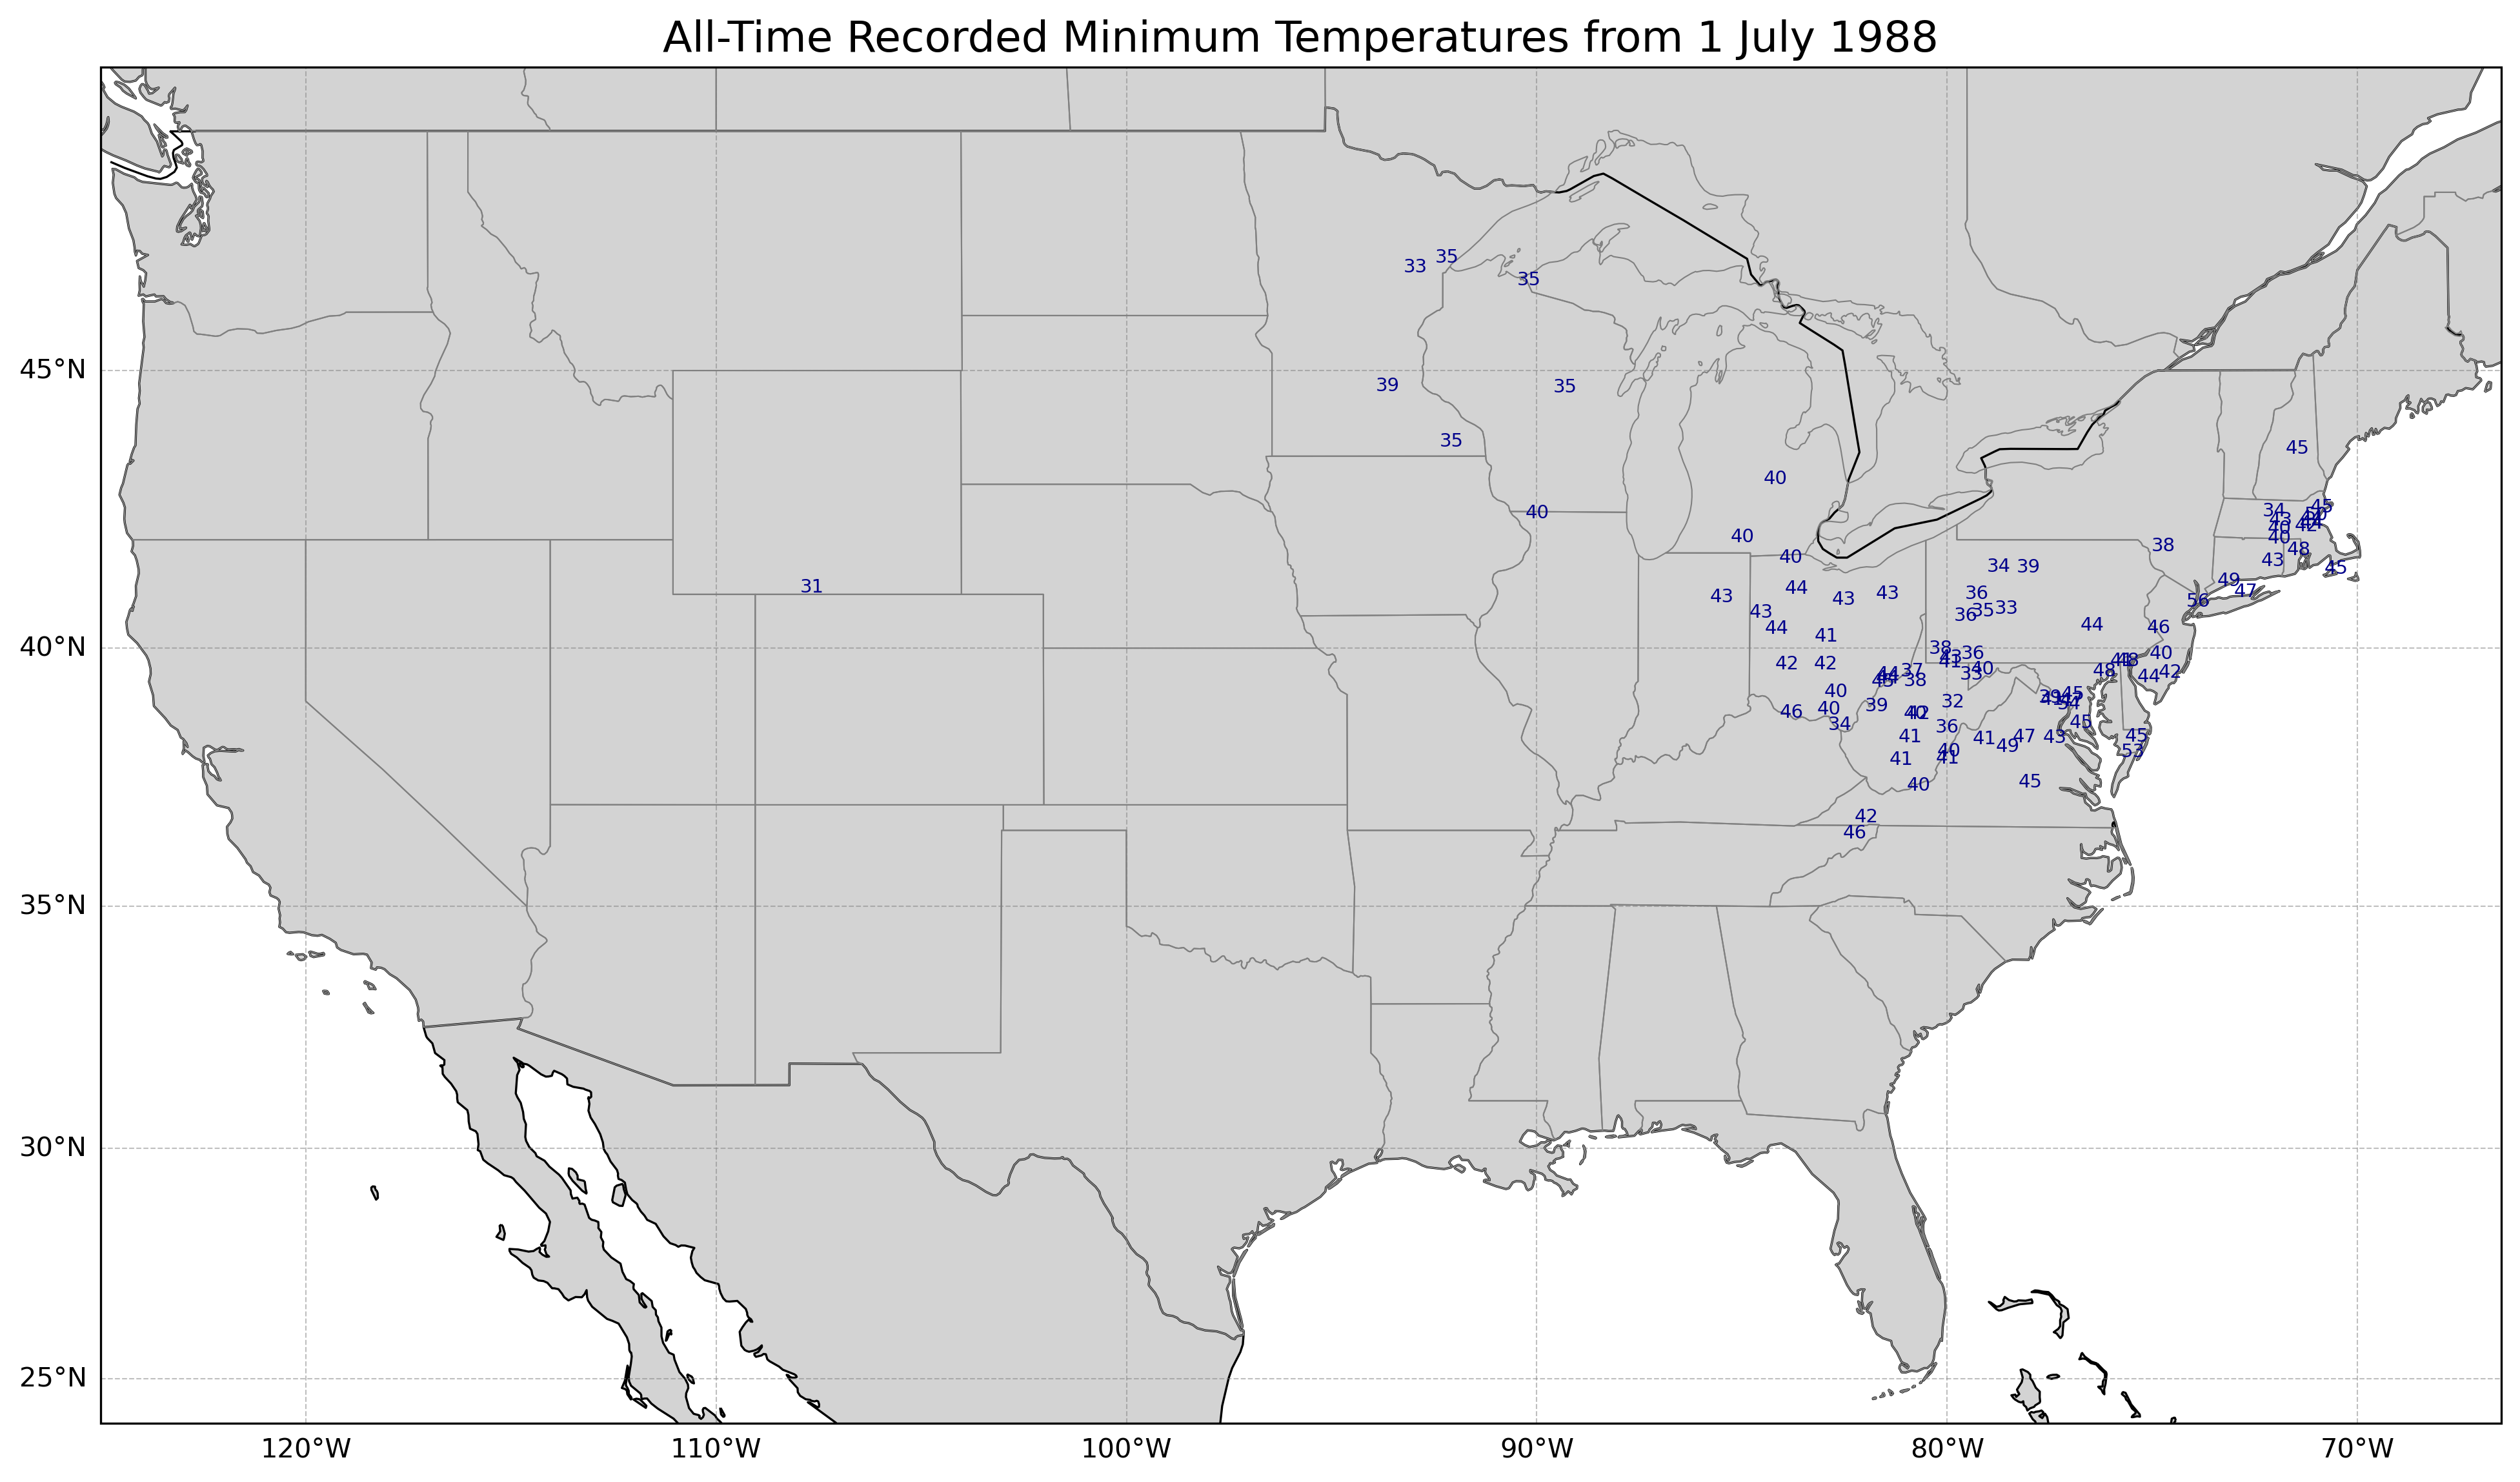
Let's step back a few years to 1988. The first day of July had 93 all-time record lows, the most in the month that had 192.
The Daily Weather Map shows a surface high pressure center over Lake Superior, with a cold front extending far to the south, almost to Florida, and that front actually made it to southern Florida two days later!
A strong 500 hPa trough was centered over the northeastern US. According to the ERA5 reanalysis, a 544 dekameter (5440 meters above sea level) low at 500 hPa was at 44°N, 72°W, which was the lowest July height for a 500 hPa low there between 1940 and 2025.
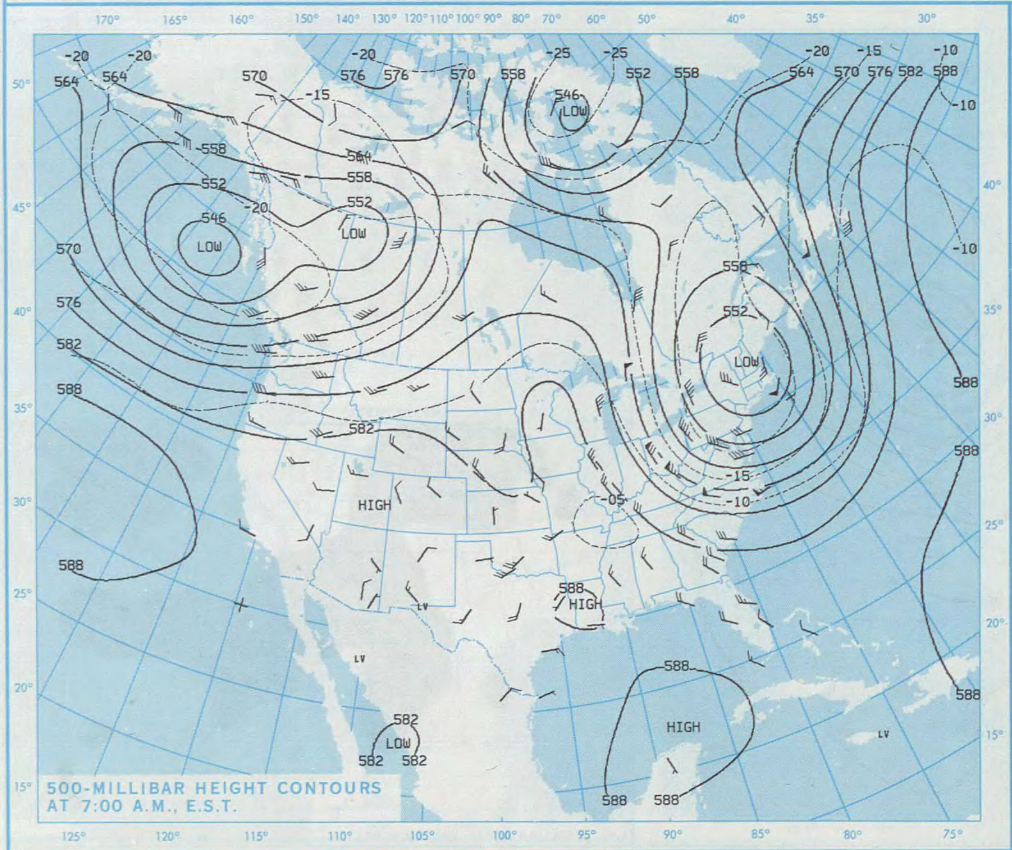
The cold air at 700 hPa extended south along the east coast of the United States, farther south than that lobe north of Spain. Here is the map from the PSL reanalysis, showing temperatures of 265 K or around -8 C/18 F around 3000 meters/10000 feet over Pennsylvania.
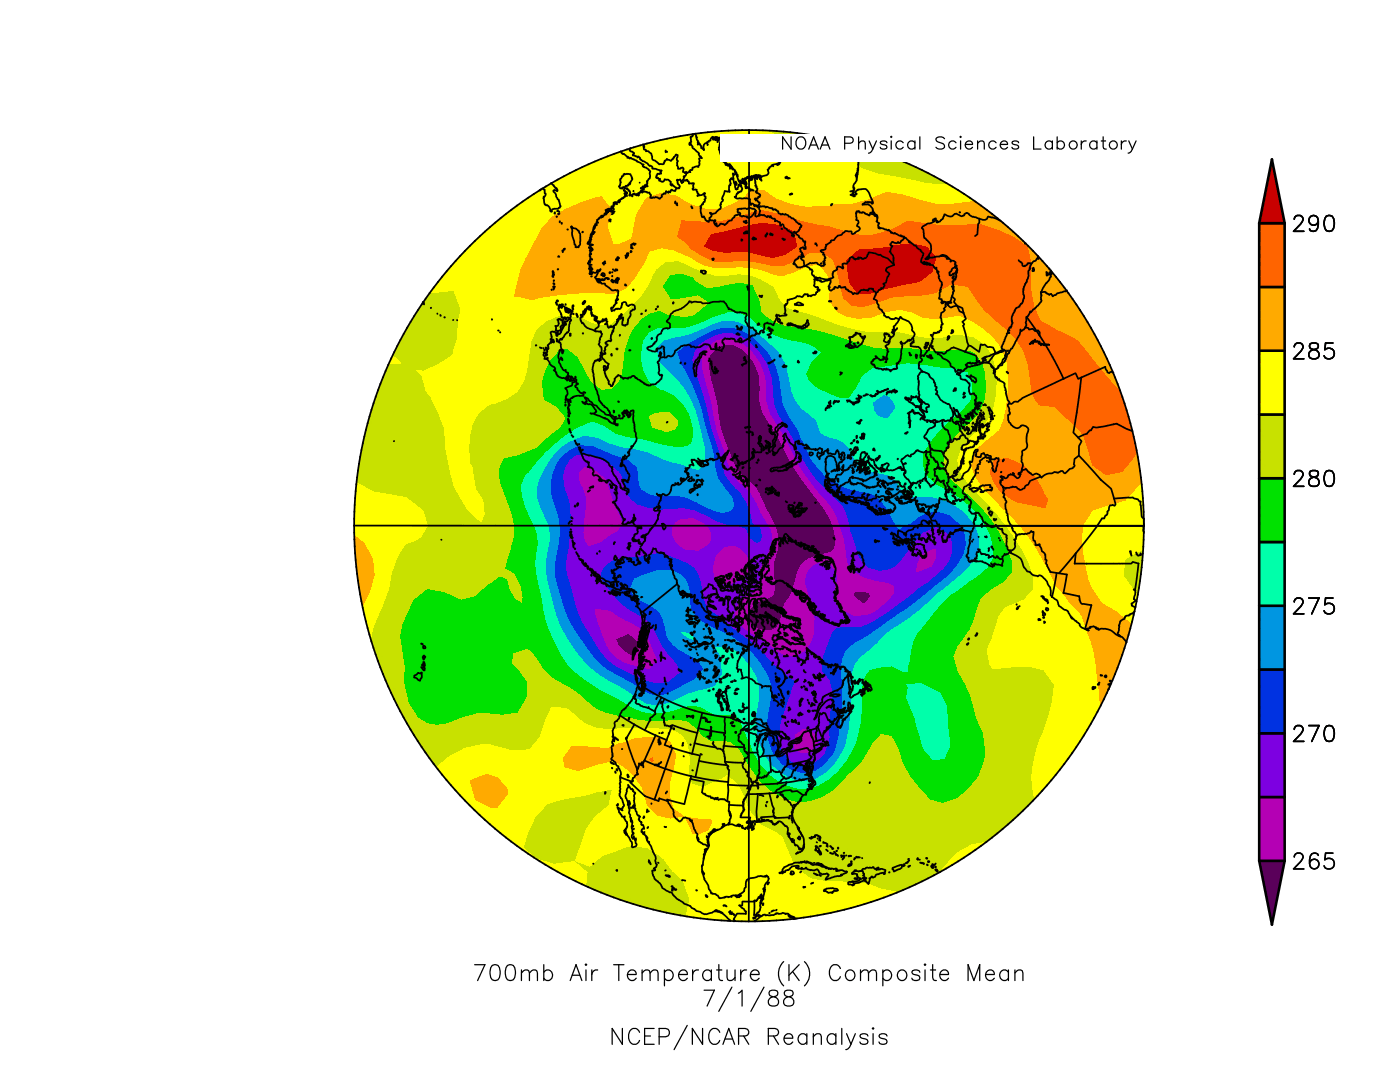
Showing the PSL reanalysis anomaly map, there was a bulls eye over Pennsylvania and New York of around 10 deg C below normal.
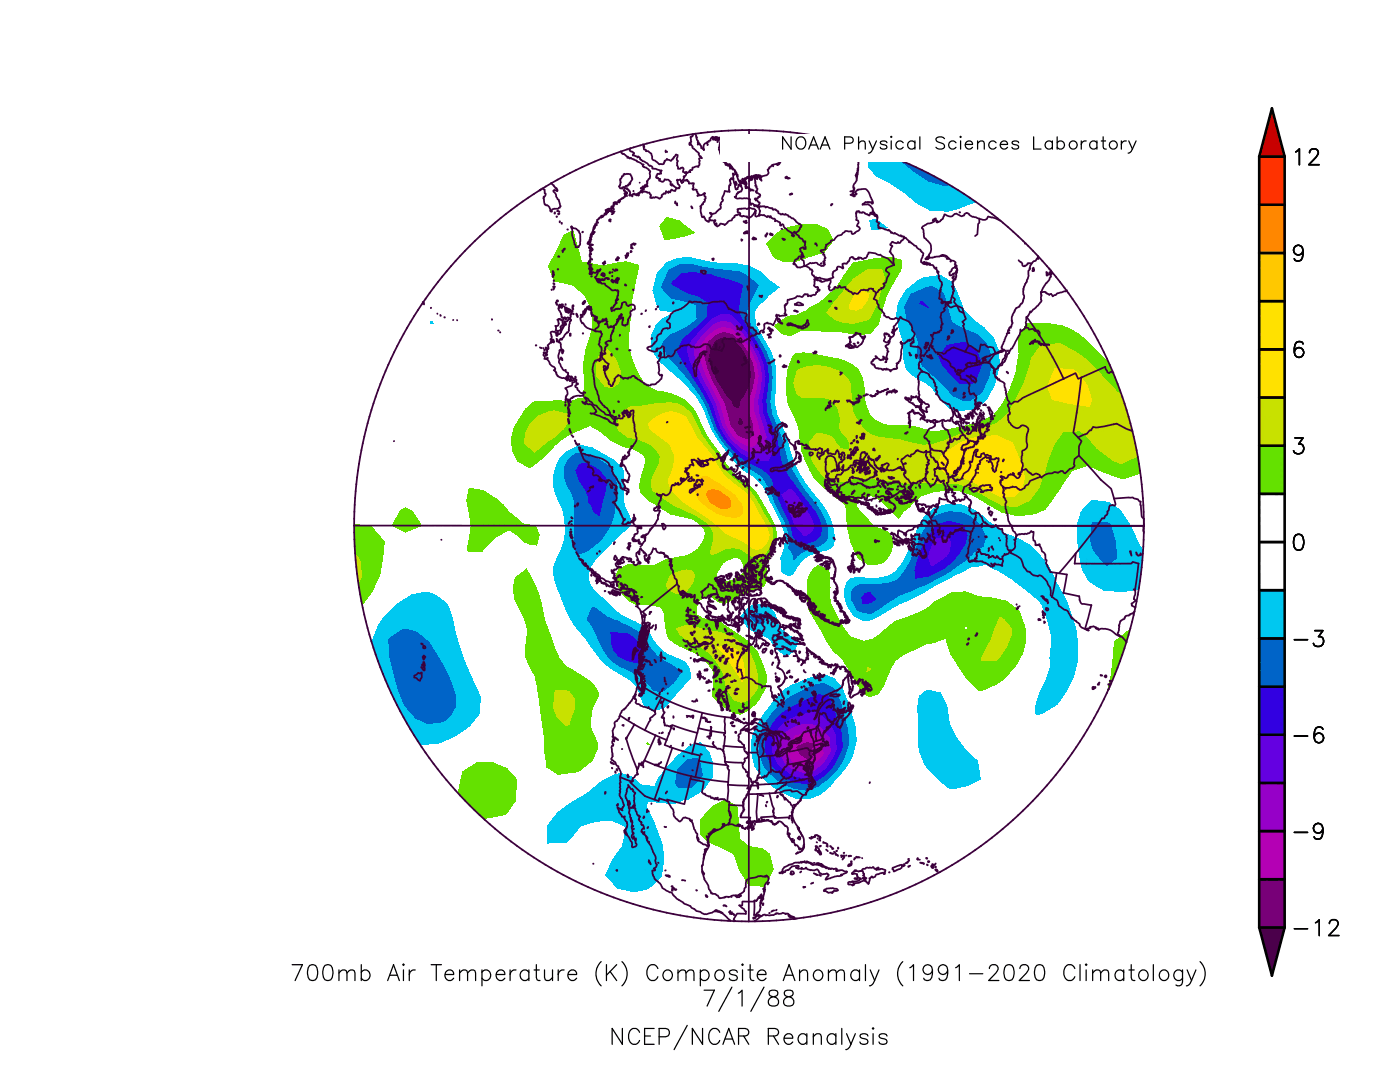
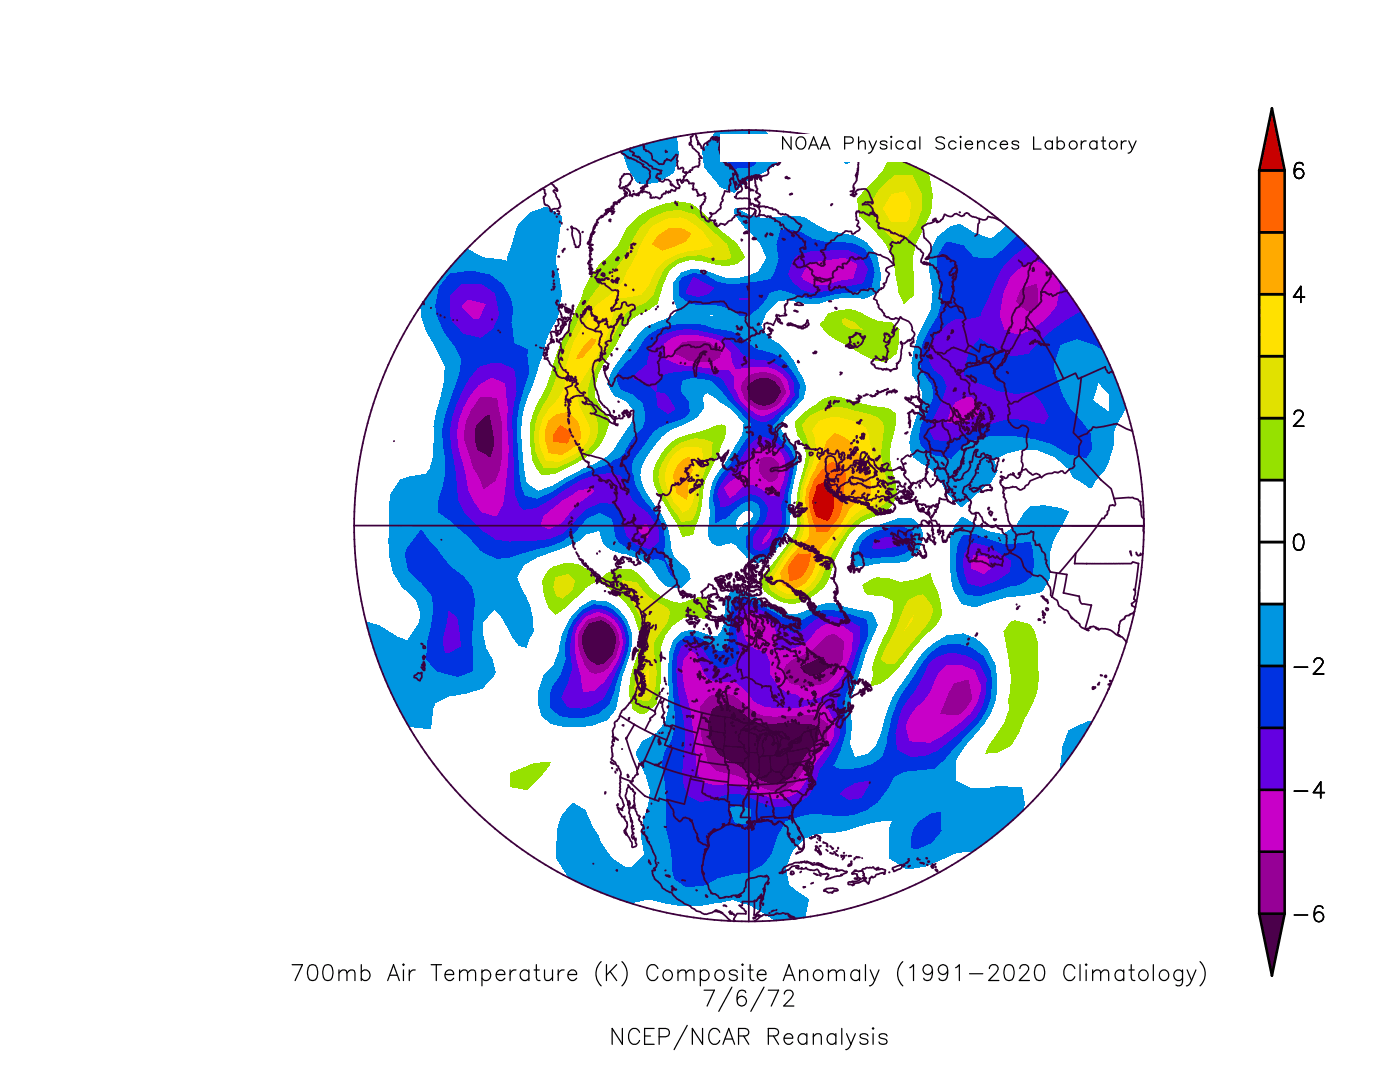
#1 for most all-time record lows was 1972. The first part was the cold part (similar to the other years presented) with at least 10 all-time record lows each day between 3 Jul and 8 Jul 1972, and 6 Jul 1972 had 67 all-time records followed closely by 5 Jul 1972 with 66. We will look at 6 Jul 1972, but since 5 and 6 Jul were basically a tie, we will look at the all-time record lows for both dates. First, 5 Jul 1972:
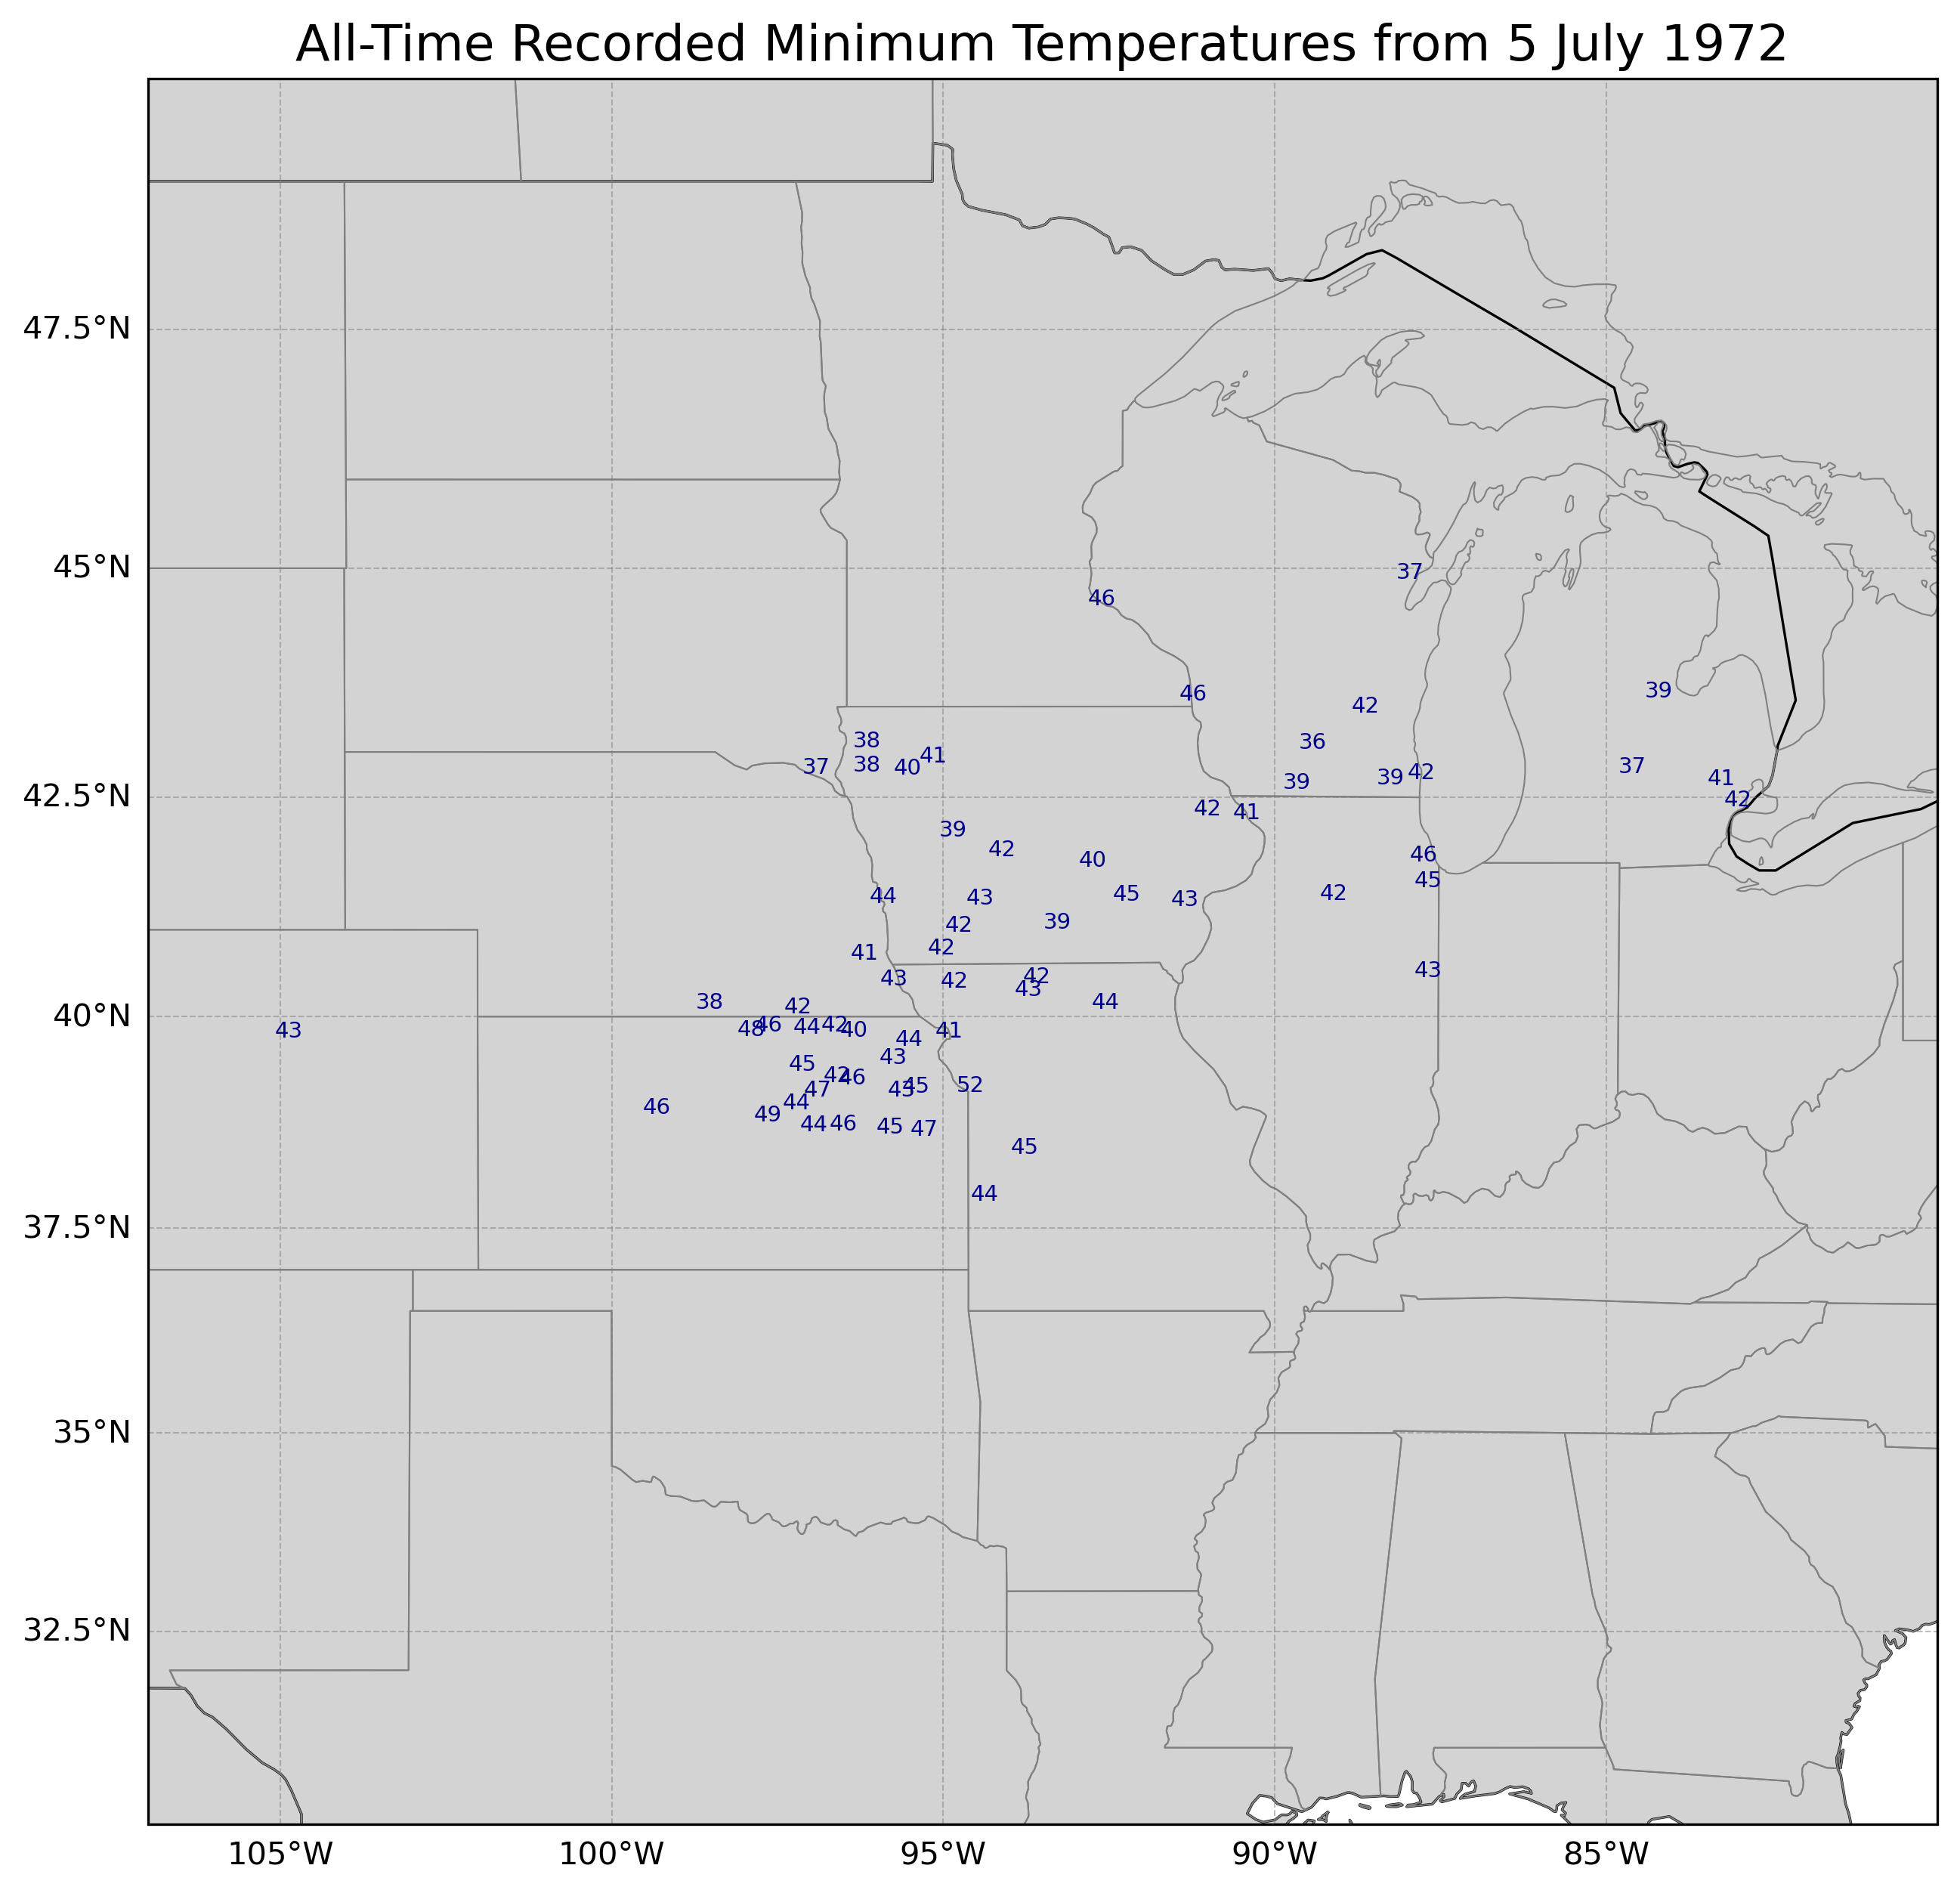
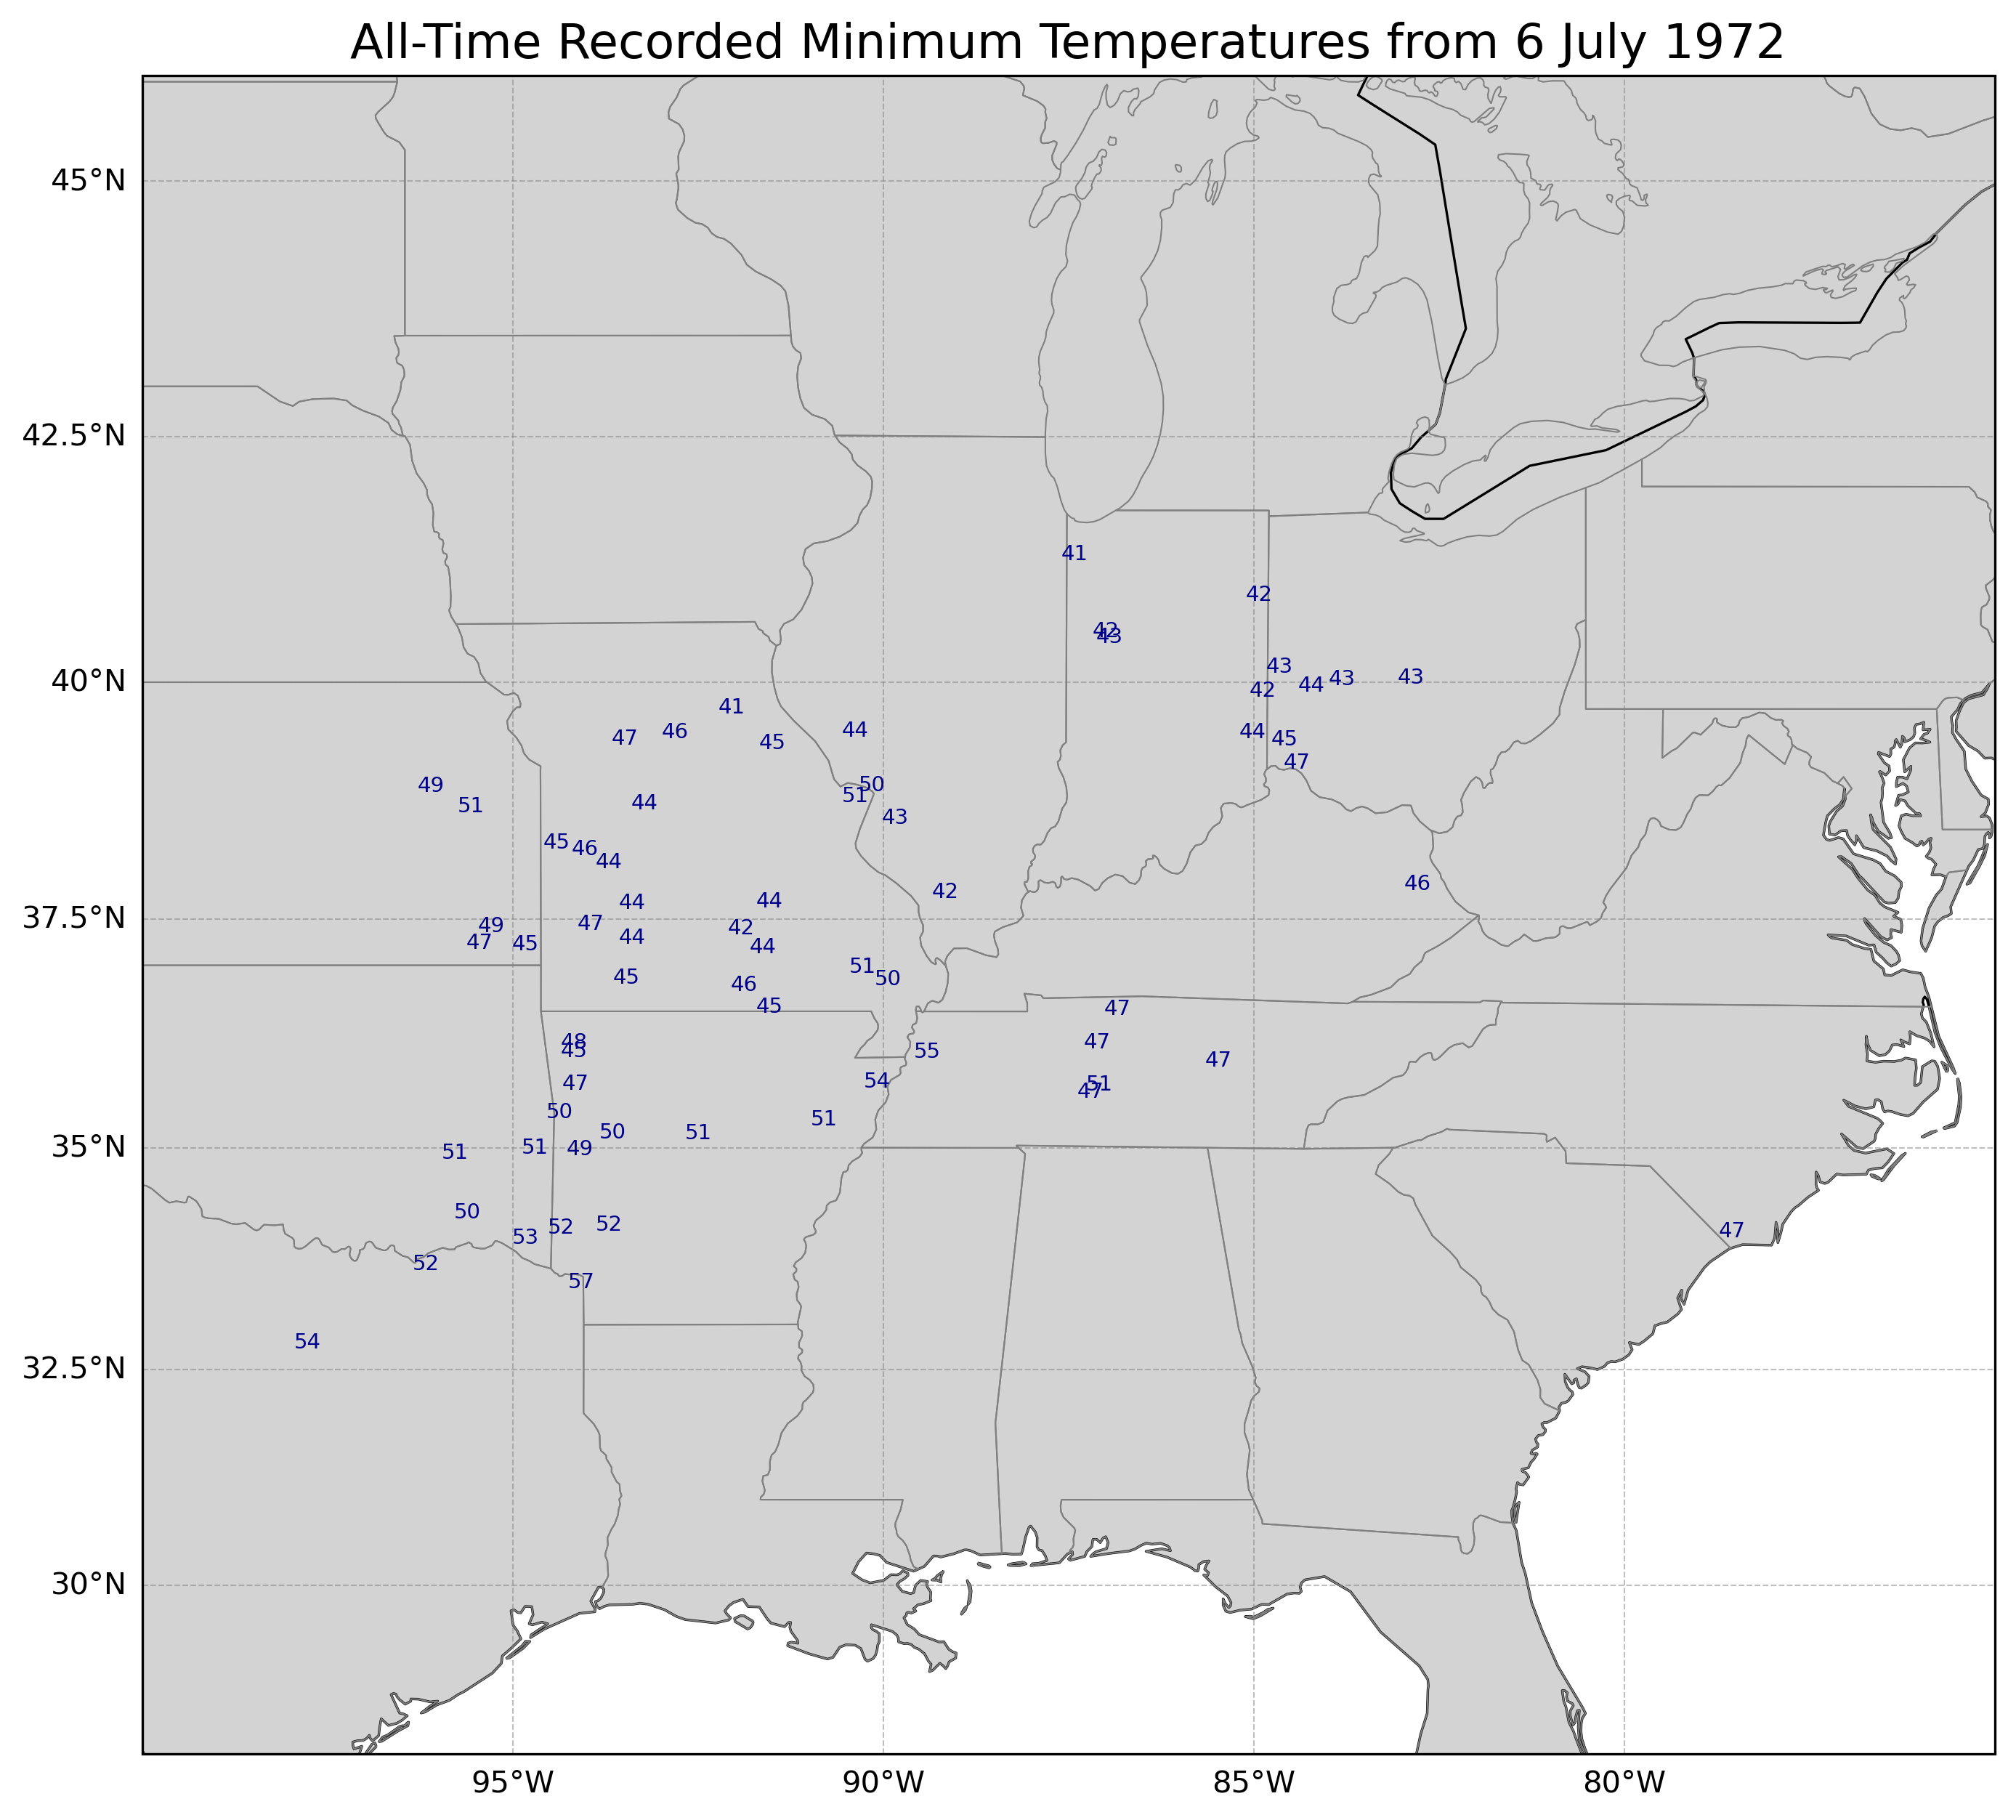
And now 6 Jul 1972. As the cold air mass shifts southeast, so do the locations of the all-time record lows.
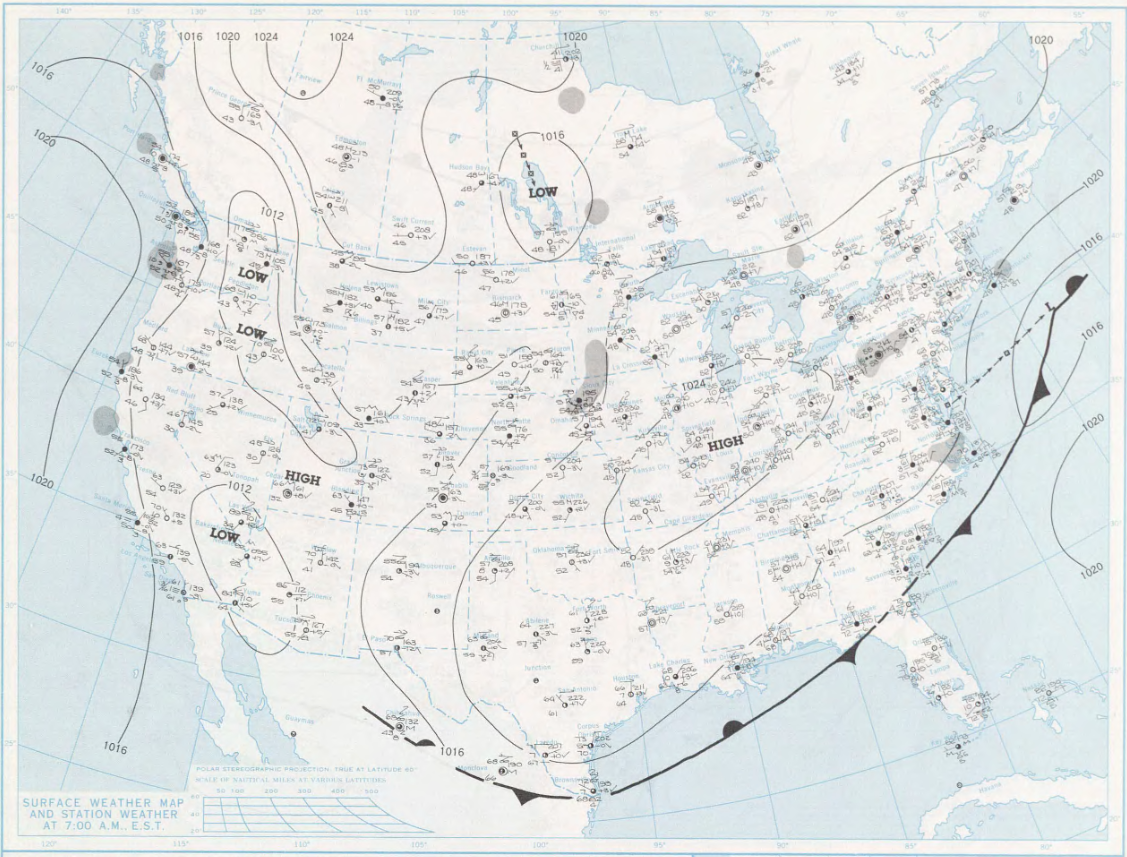
The surface high, which was over western Canada four days earlier, had moved into the Lower Midwest, with the cold front reaching Florida and the south tip of Texas.
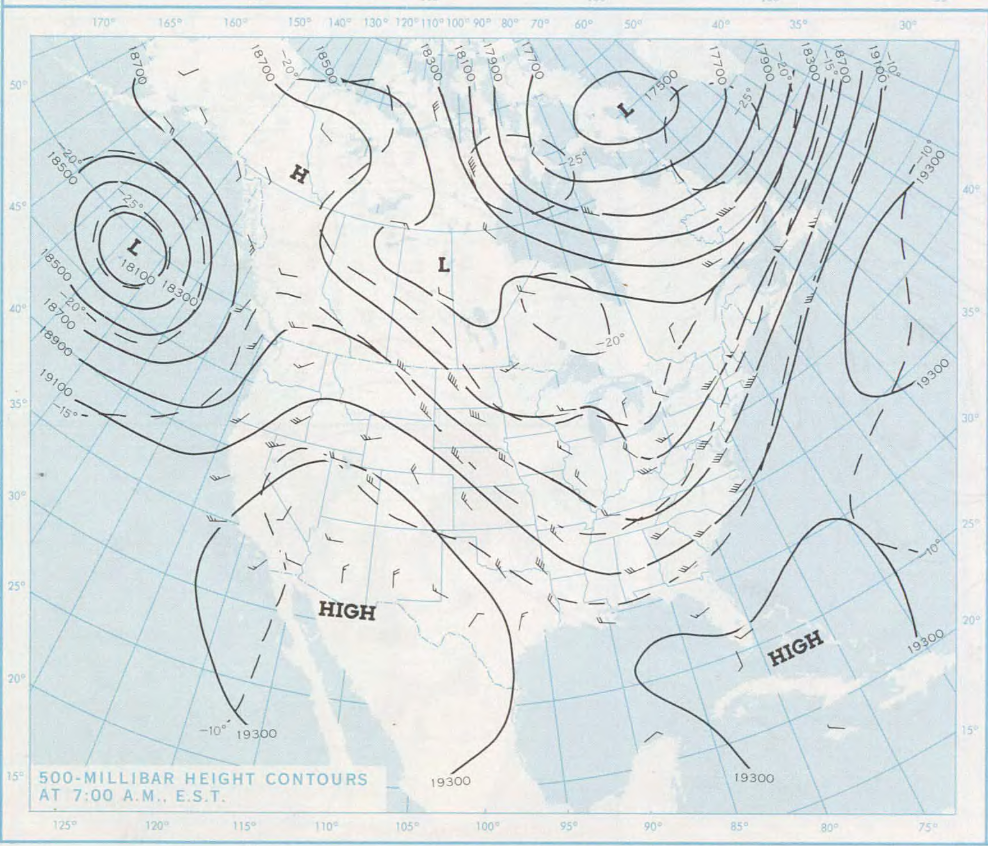
At the 500 hPa level, the ridge of high pressure was over the southwestern United States, with the corresponding trough over the eastern half of the United States, connected to a deep low over far northeastern Canada. Note that in 1972, the daily weather maps used feet instead of meters or dekameters for the 500 hPa heights.
The 1972 case had a broader cold pool at 700 hPa than the 1988 case where the cold pool was narrower but deeper and more intense.
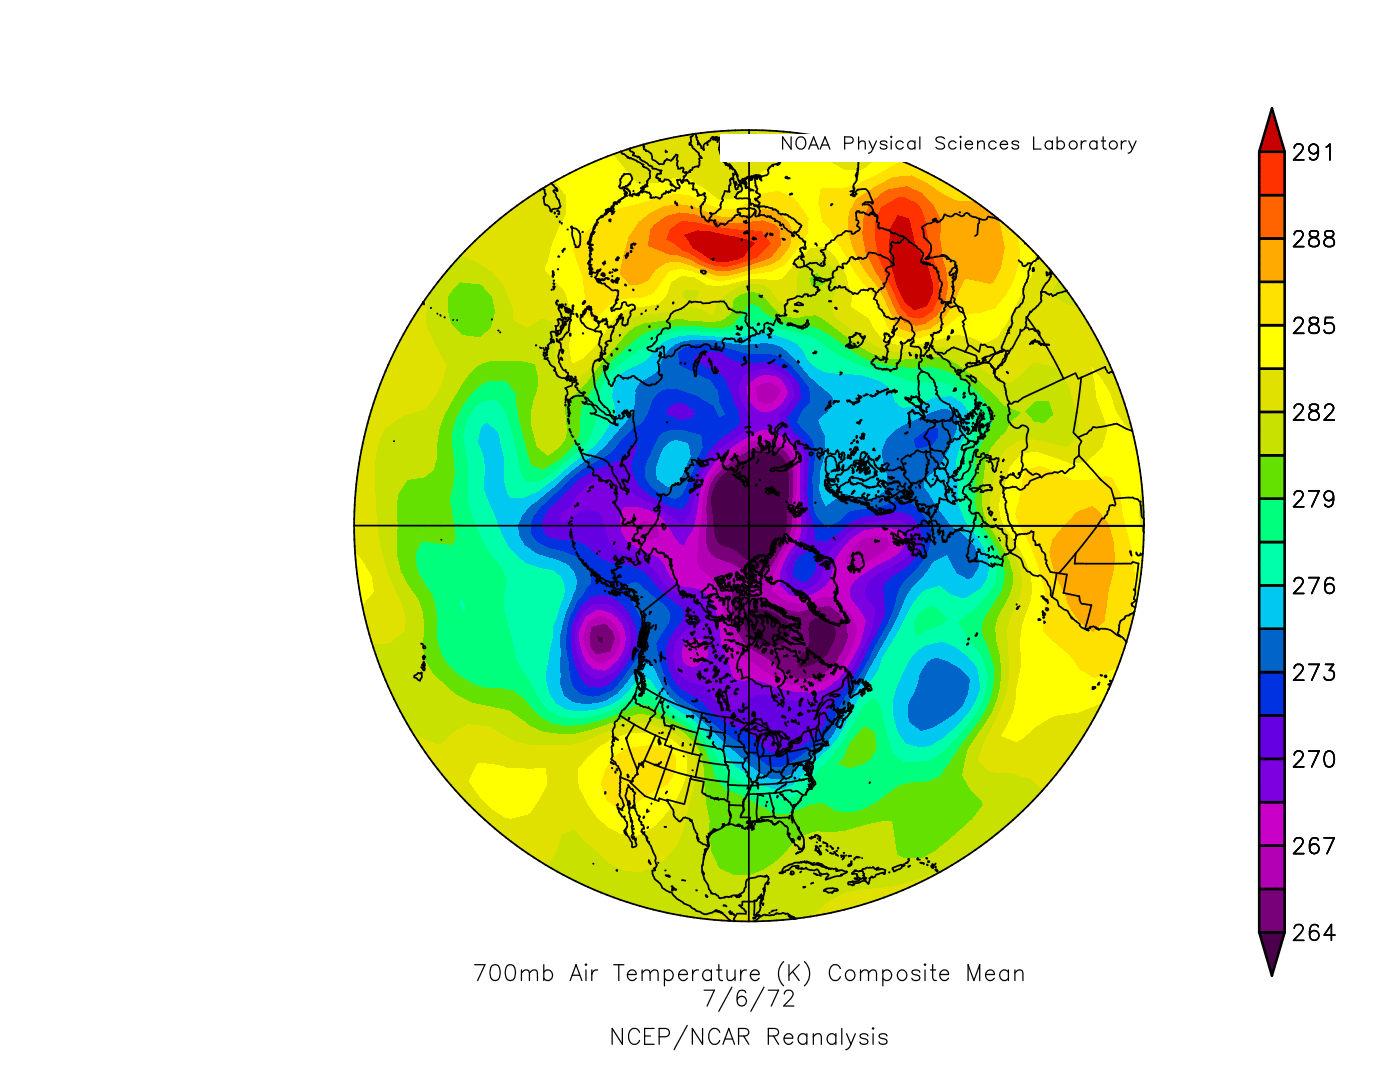
The broader cold pool is reflected in the 700 hPa temperature anomaly map with the 6 deg C (or greater) cold anomalies covering the region from the Dakotas to New England (though, again, not quite as intense as the 1988 case which had some 10 deg C cold anomalies.
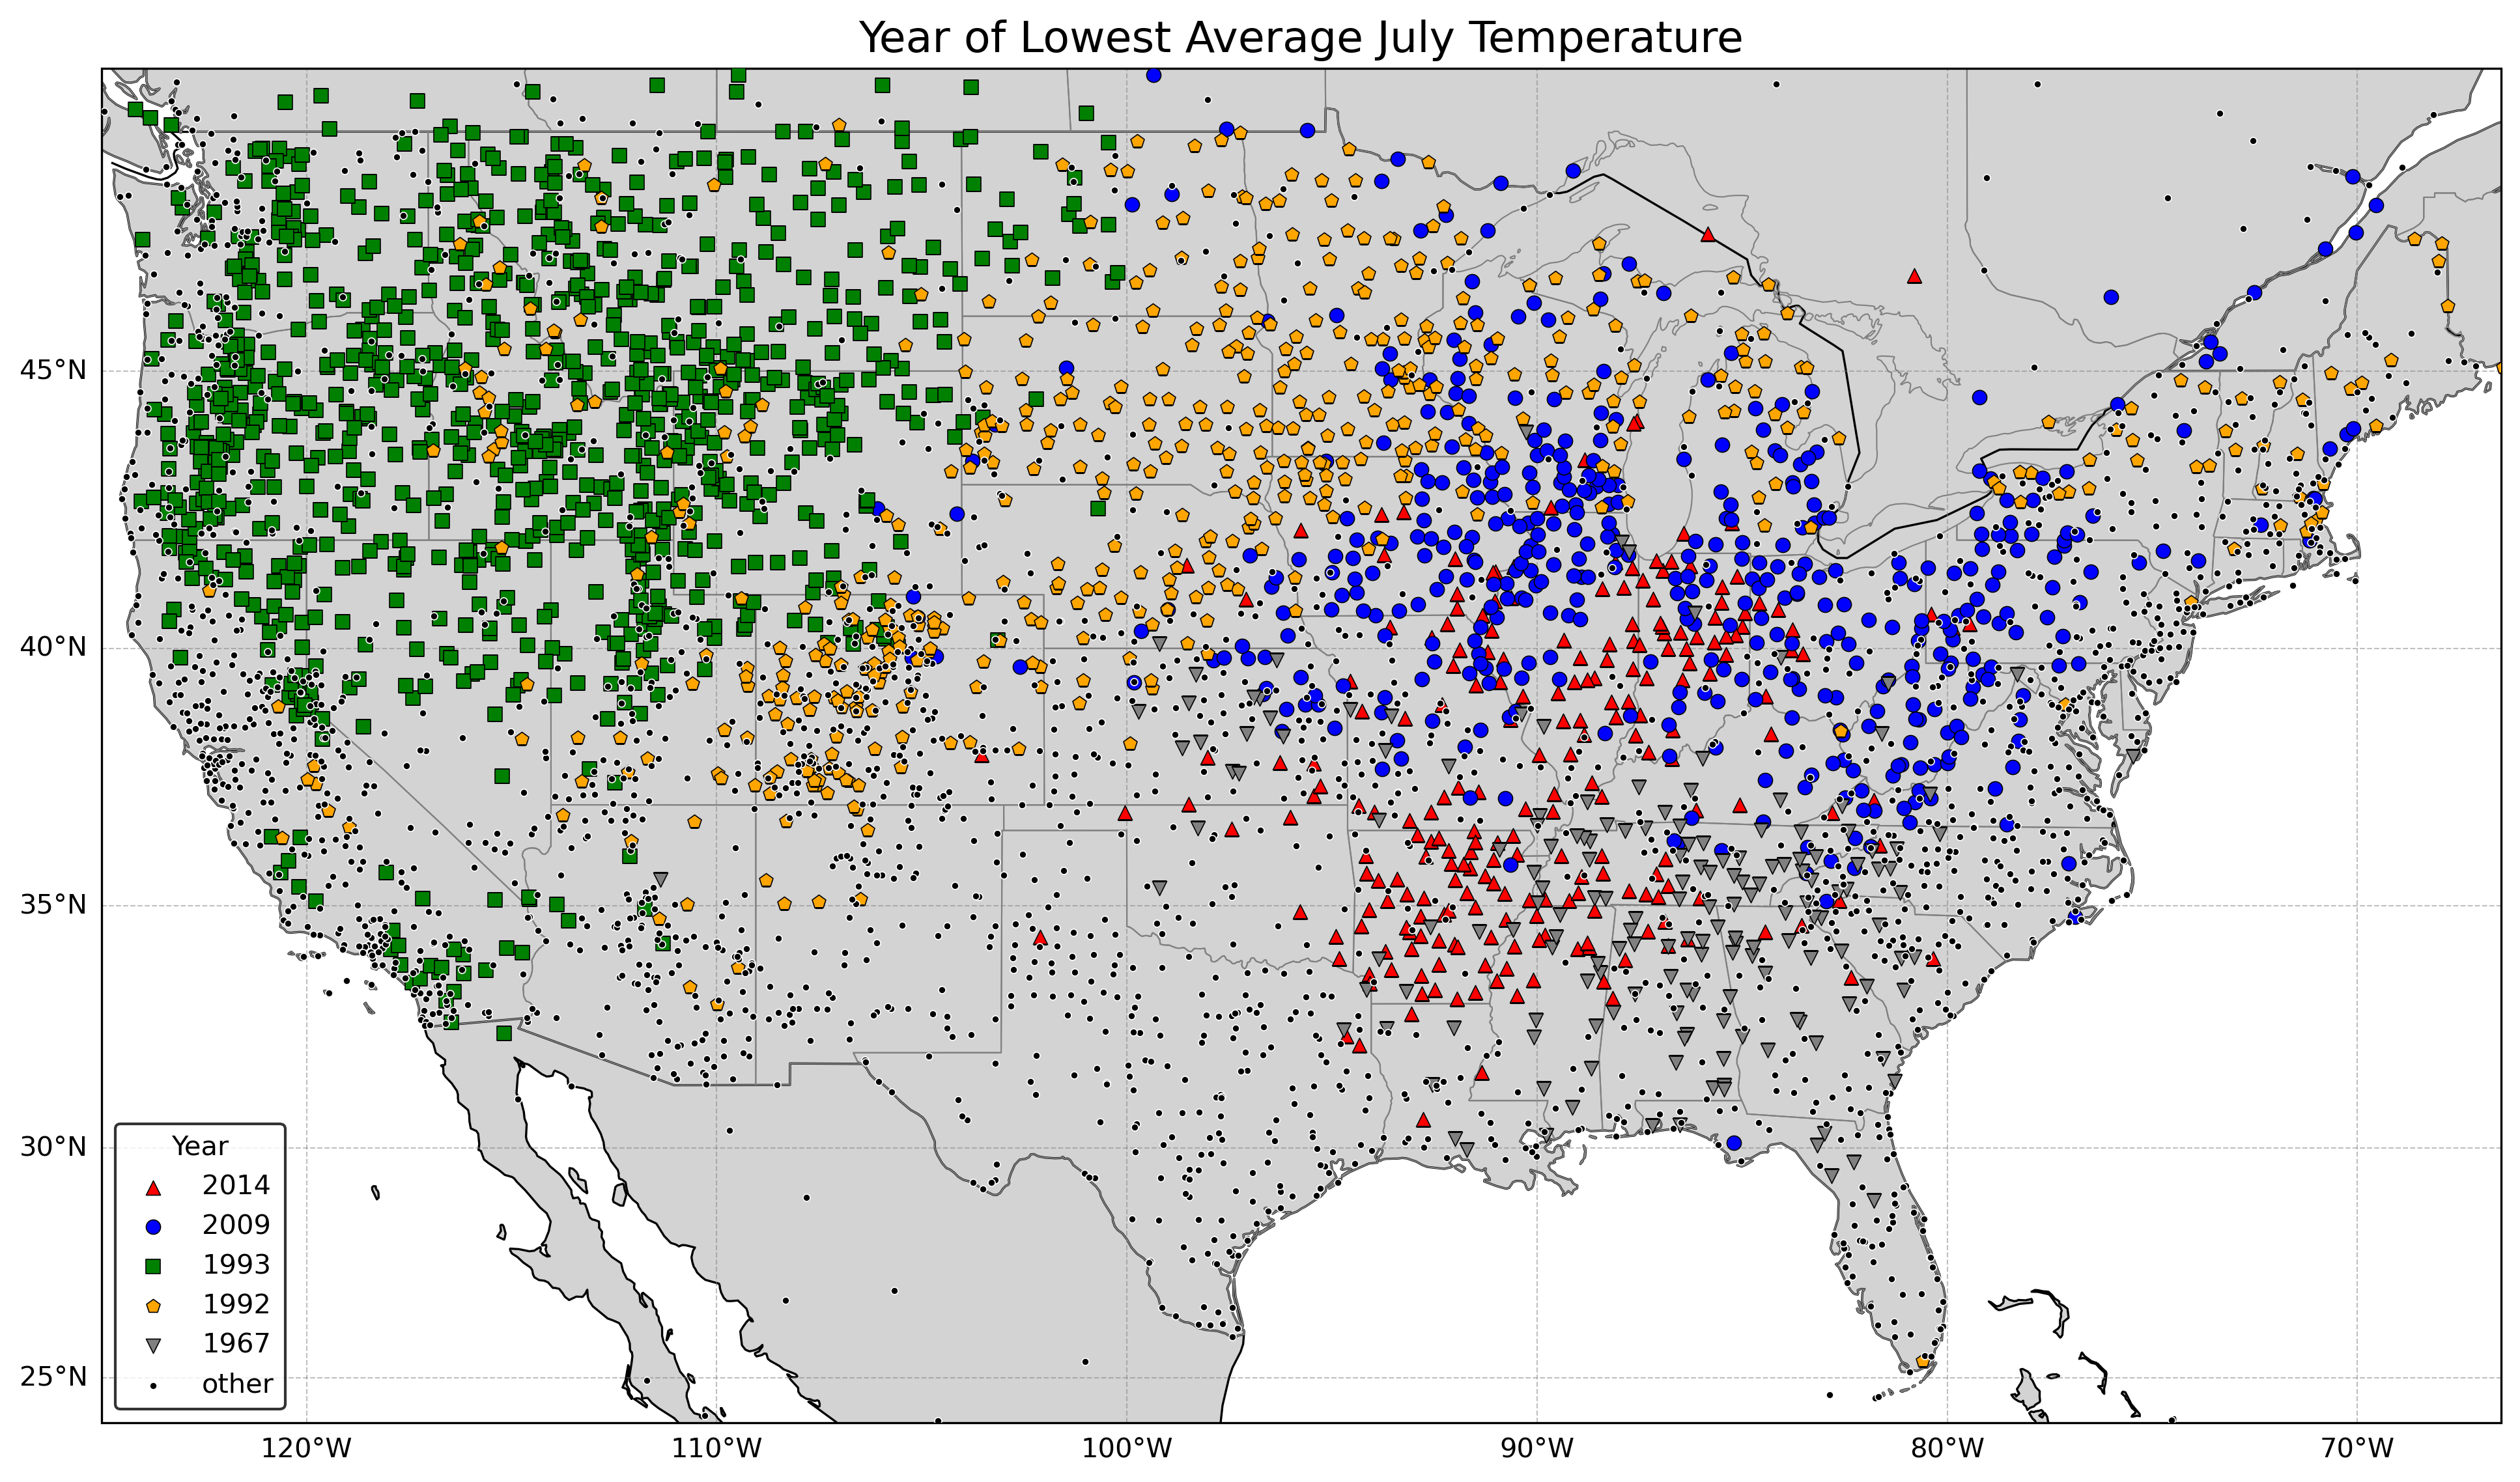
If we look at the July lowest average monthly temperatures, the five Julys that have the most stations recording their lowest July average temperature of any year are considerably different from the Julys that have the greatest number of all-time record low temperatures, with the exception being 1967 which had both 148 stations recording all-time record low temperatures and 173 stations recoding their all-time lowest July average. Therefore, just because it was an unusually cool month does not necessarily mean a place will be setting all-time record low temperatures.
Rank       Year         Number of All-Time July
                        Record Low Temperatures

1.         1993                  679
2.         1992                  467
3.         2009                  440
4.         2014                  234
5.         1967                  173

All other years                 2683
Here is the map showing the year with the lowest July average (more consolidated than the all-time lowest July temperature).
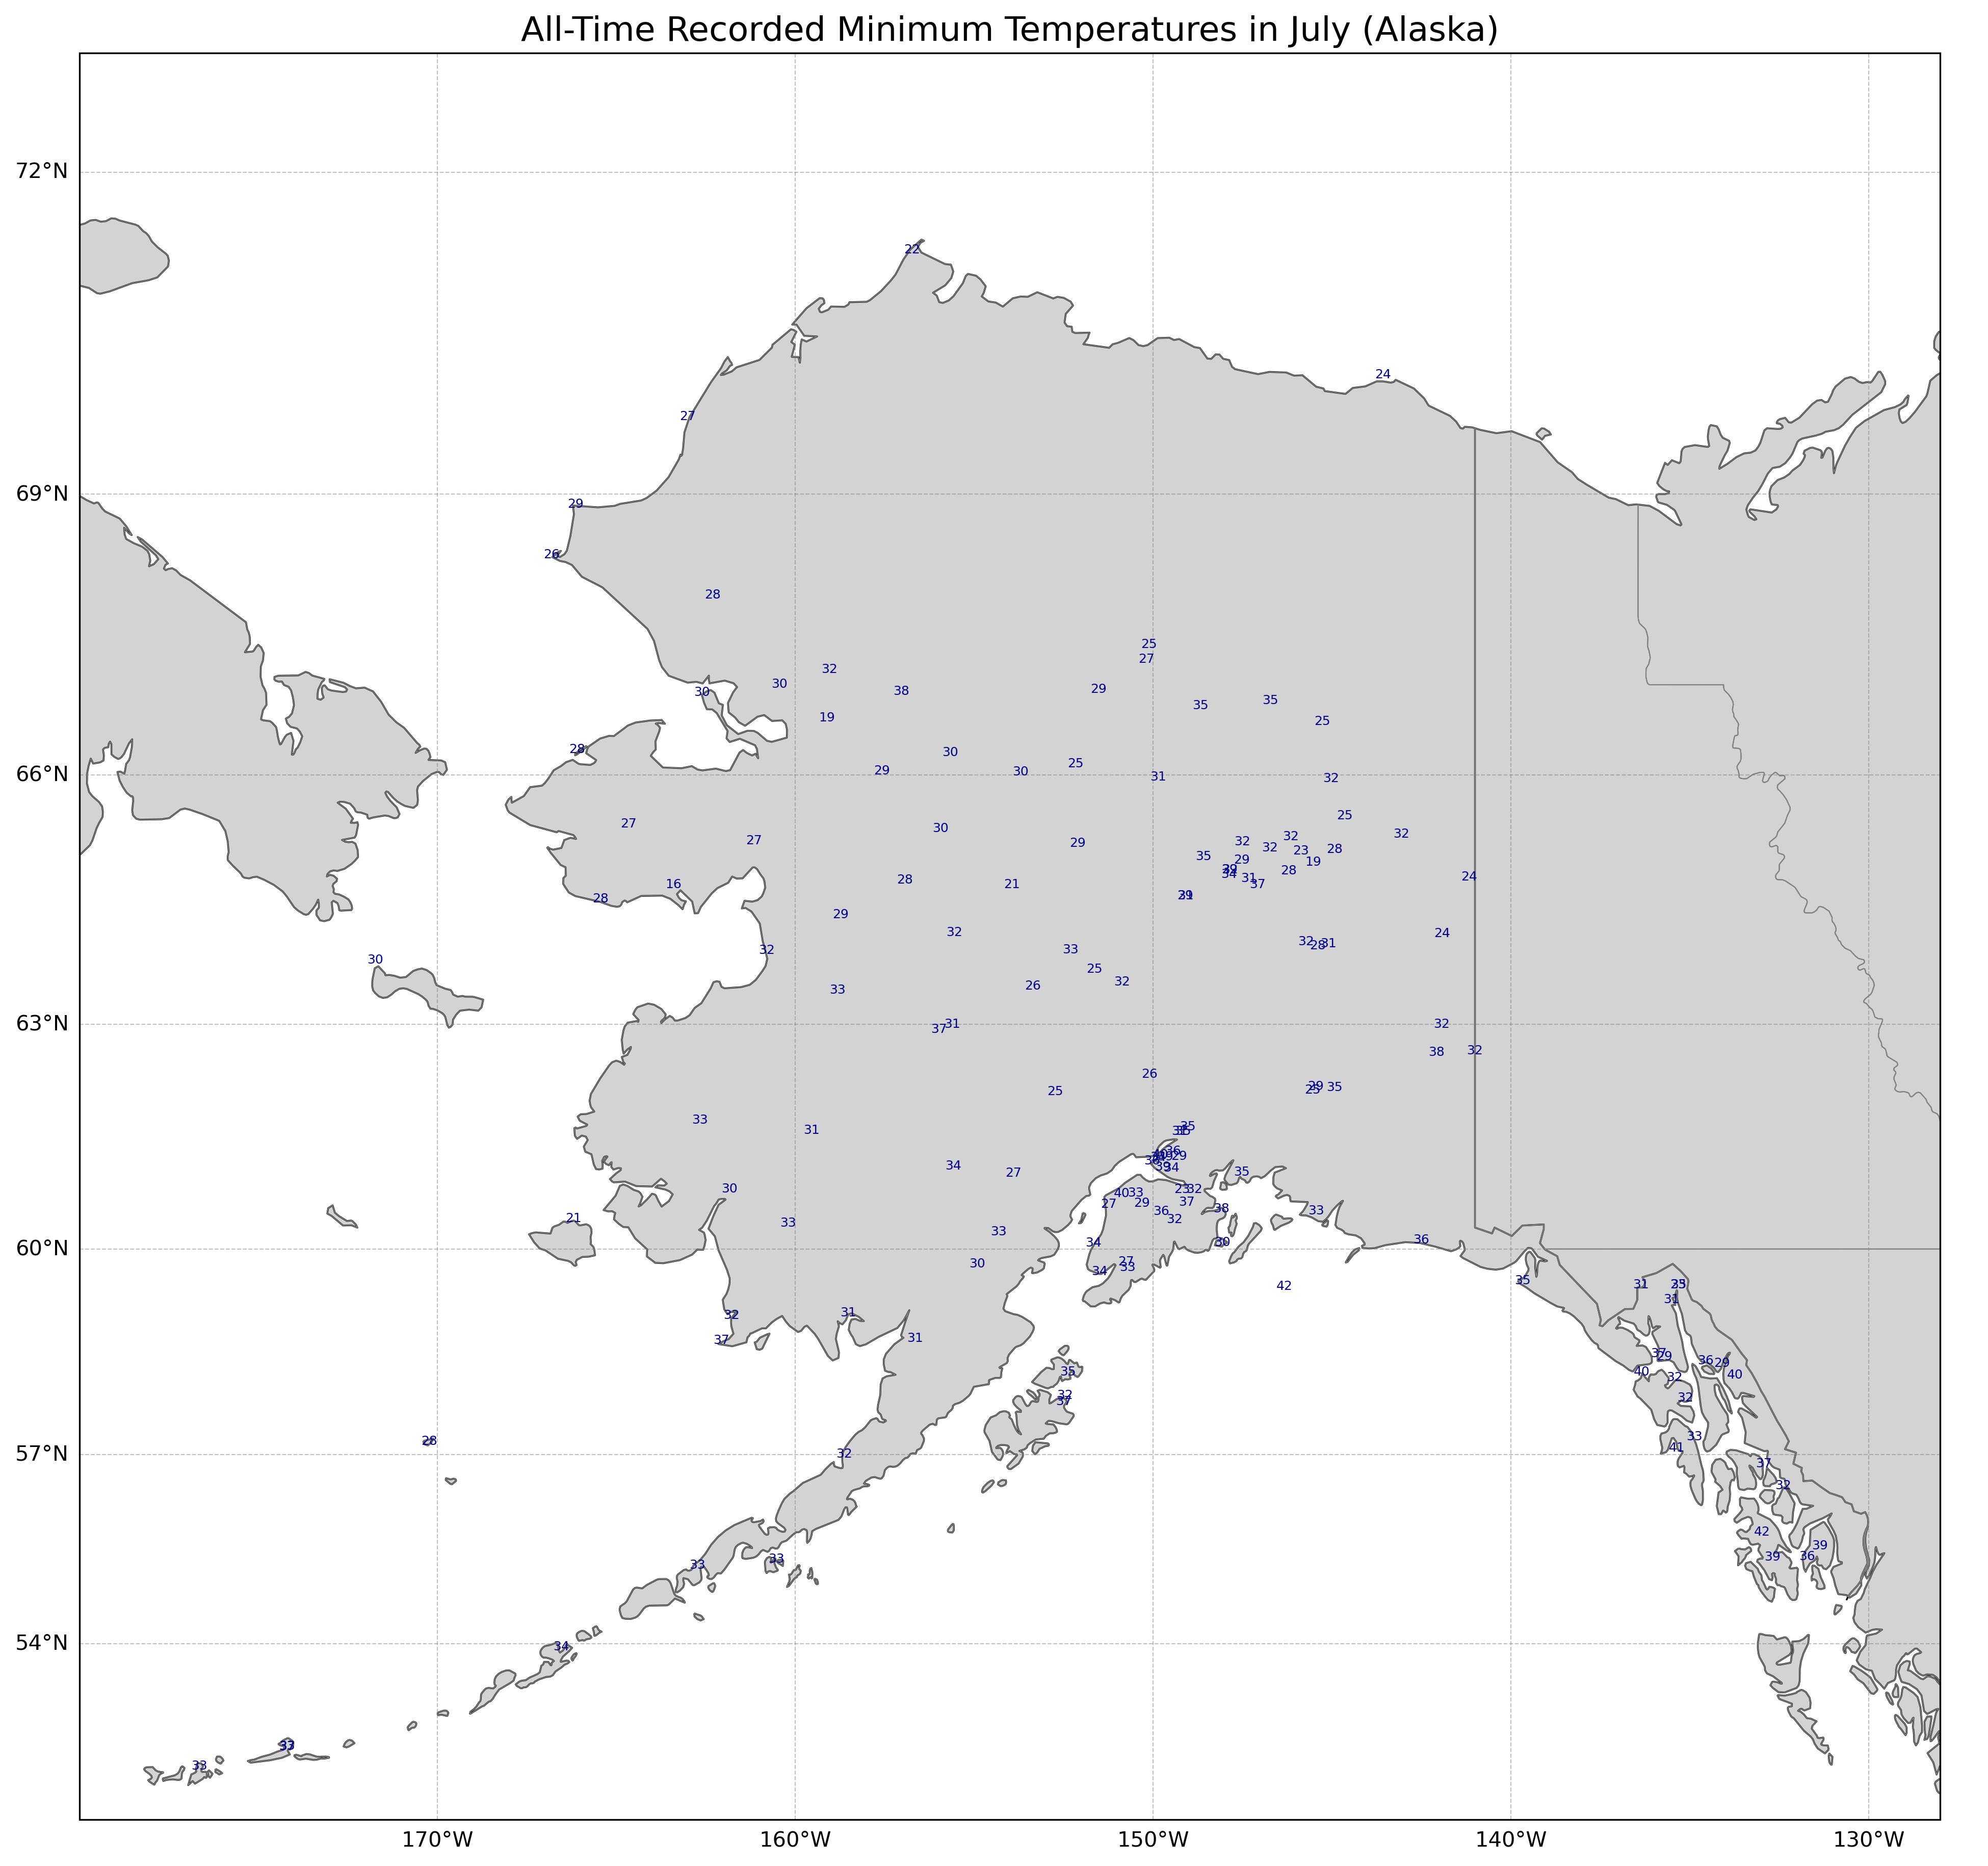
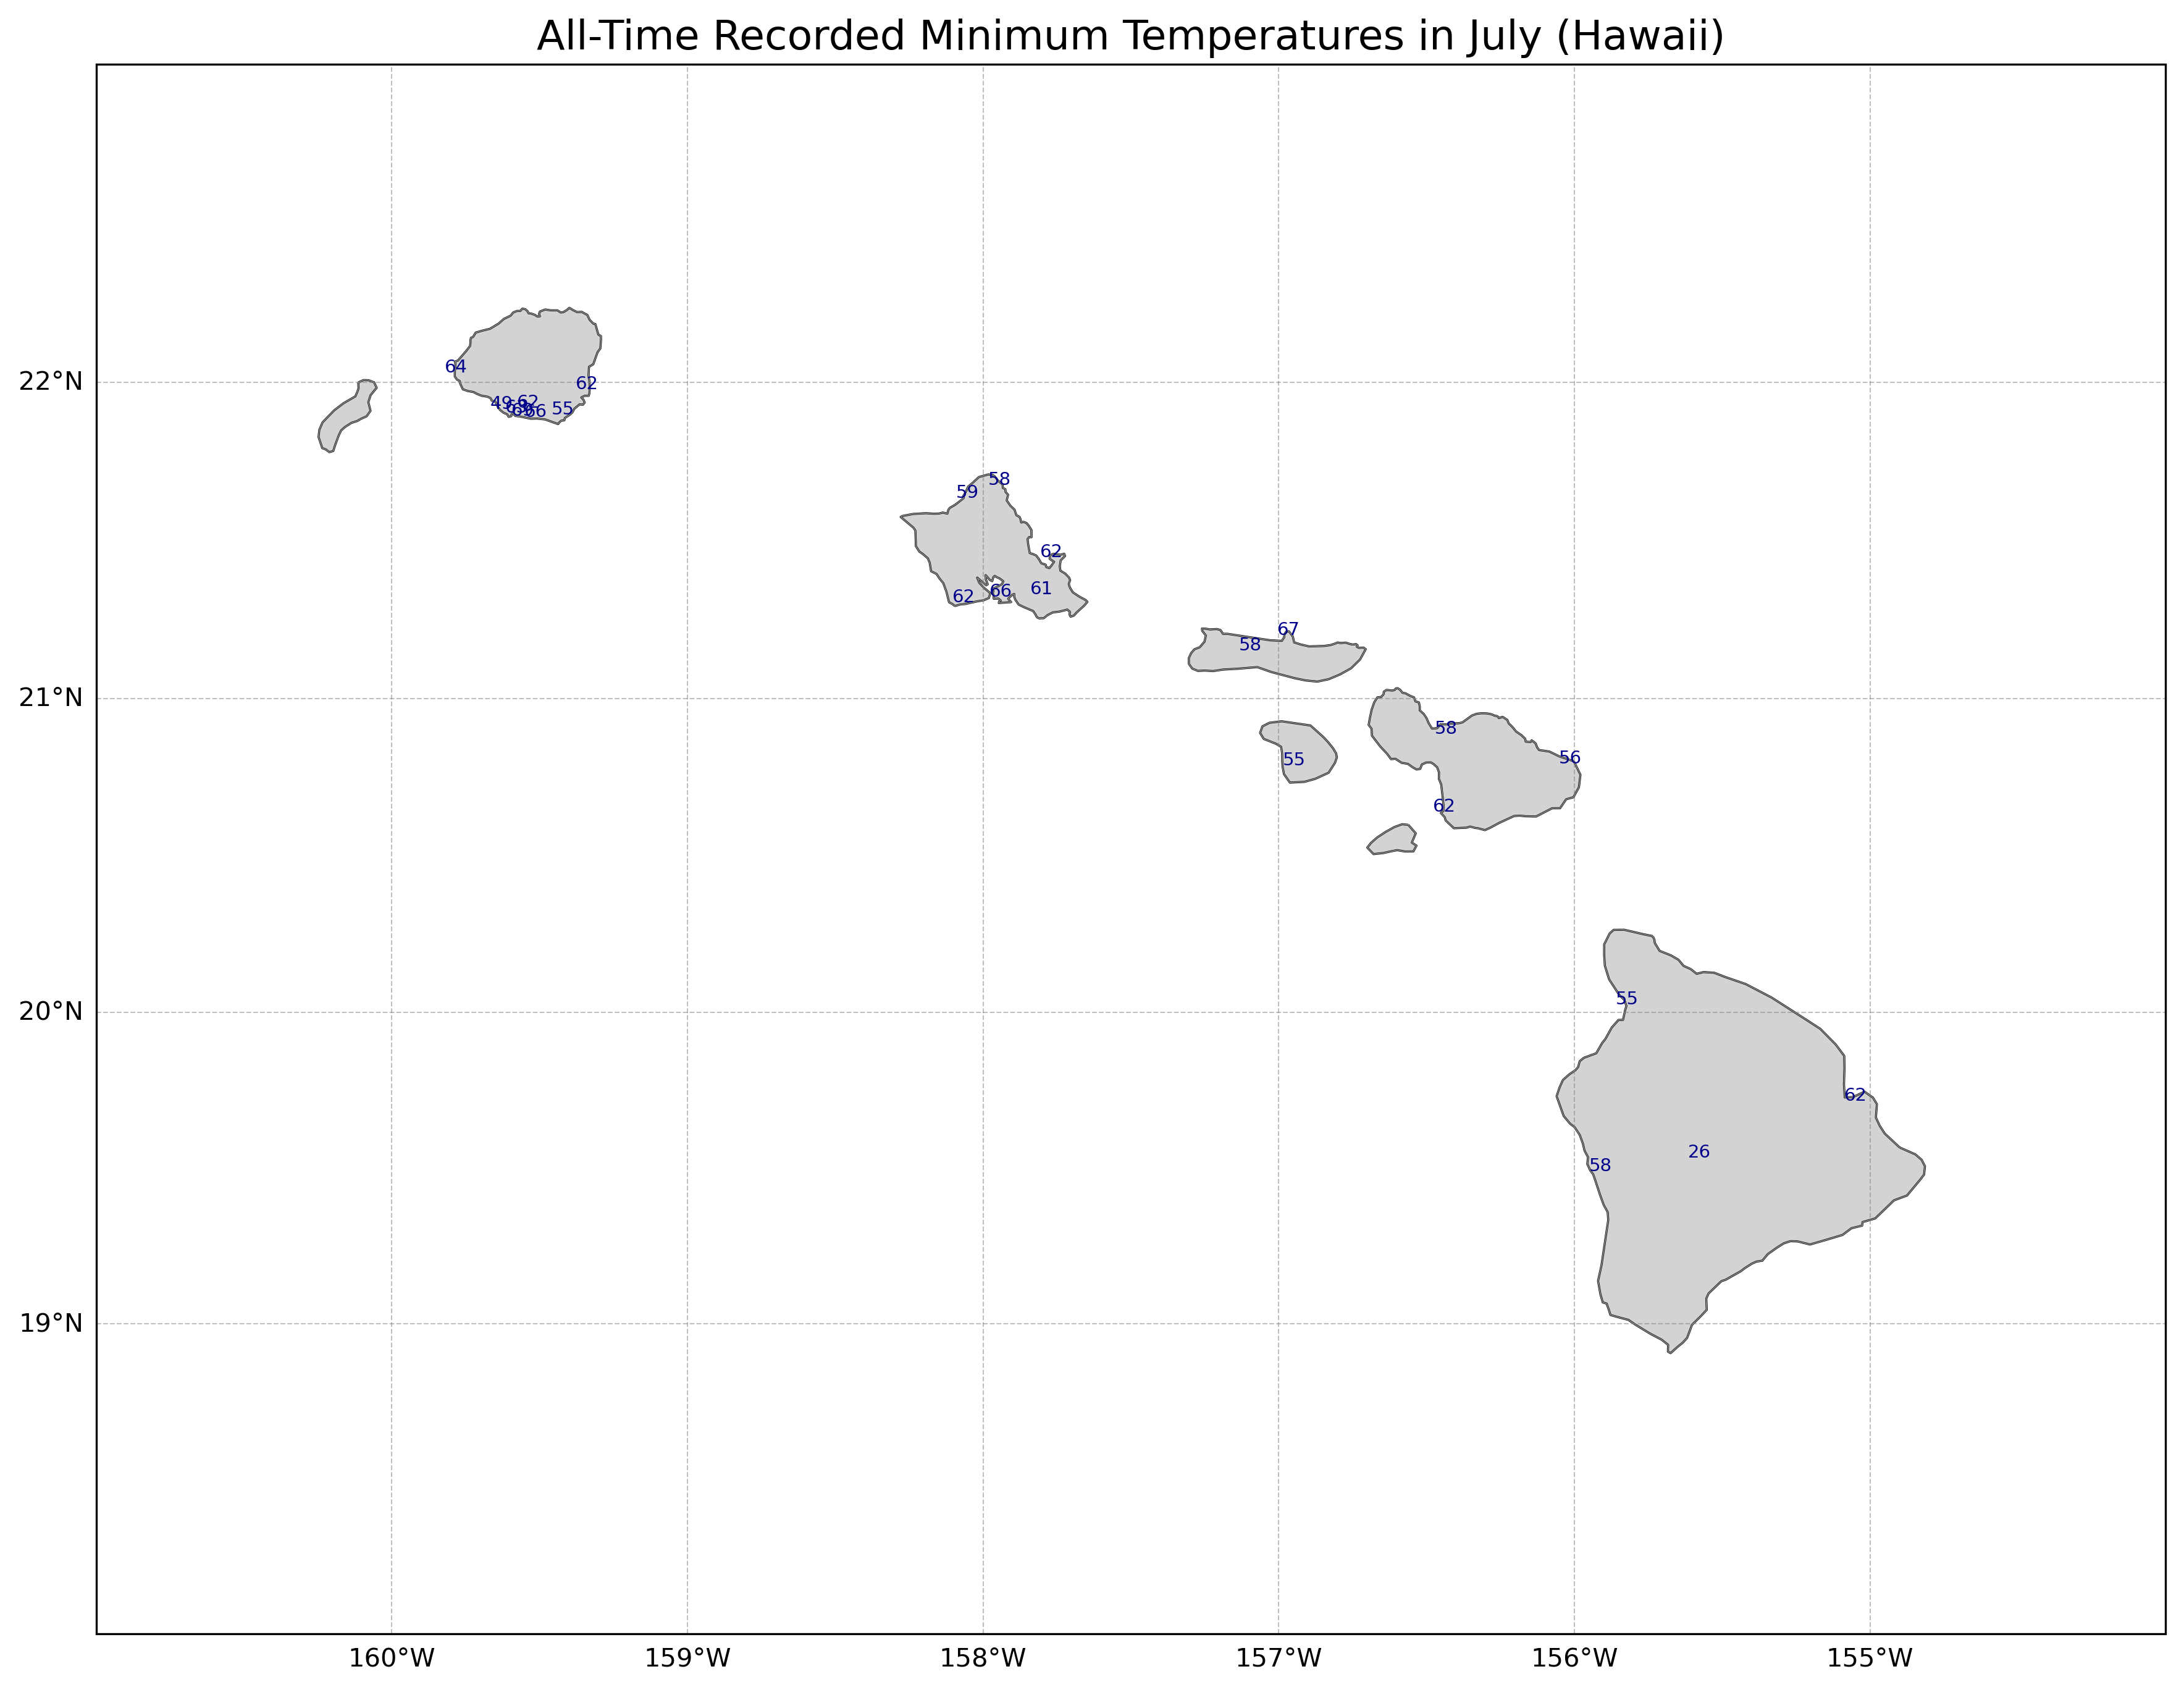
Before we go, let's take a quick look at Alaska and Hawaii to see their all-time record July lows. Alaska is mostly in the 20s and 30s, while Hawaii is mostly in the 50s and 60s (not surprisingly, that 26 F/-3 C reading is from high up (11000 feet/3300 meters) on Mauna Loa.
Come back soon for analyses of weather and climate, anywhere from California to other parts of the US to around the world!
Some of the future topics will include:
The wettest atmospheres in the world (based on "precipitable water")
Timberlines (highest elevation that trees can grow in a mountain range) and climate
Maximum precipitation rates reported given a certain temperature
Case studies of unusual storms