
Periodic analyses of weather and climate will be posted here, with links to previous editions at the bottom. Remember to click on the image if you need to zoom in (especially important in this blog entry!).
A major heat wave hit a large part of Europe in late June 2026. The heat built in mid-June, especially from the Iberian Peninsula (where it was already hot in many places) to southern Germany and continued to build through its crescendo, which ranged from 23 Jun over much of the Iberian peninsula to 27-28 Jun over Germany to 30 Jun farther east and southeast. This was under a classic "heat dome" where the hot weather is widespread and due to broad high pressure aloft and unusually high temperatures aloft.
The World Meteorological Organization (WMO) has a summary of the statistics of the heatwave, including some of the record high temperatures here: >a href="https://wmo.int/media/news/western-europe-has-hottest-june-record">https://wmo.int/media/news/western-europe-has-hottest-june-record. I will focus on the weather and climate maps, but a few notable facts from the WMO (and other sources) include the following all-time national record highs:
Belarus: Pinsk, near the border with Ukraine: 40.4 C/105 F
Czechia: Doksany, in the northwest: 41.9 C/107 F
Denmark: 37 C/99 F at two locations (so Denmark is still, just barely, one of the countries in the world to have never officially reached 100 F, though near-equatorial Singapore has the same all-time record high being near a lot of water)
Germany: Coschen, near the border with Poland: 41.7 C/107 F (Berlin's 39.8 C/104 F not far behind and an all=time record for them
Hungary: Szécsény, near the border with Slovakia: 42.0 C/108 F
Slovakia: Kamenica nad Hronom, near the border with Hungary: 41.3 C/106 F
All-time national June records (usually with slightly higher temperature readings having been recorded in July, especially July 2019) were set in Austria, the Netherlands, Switzerland, and the United Kingdom. Numerous cities (including Bilbao, Spain, discussed more below) set all-time record high temperatures for any month. The anomalous heat reached as far north as around Copenhagen, Denmark, though the Nordic countries mostly missed out on the heat wave .
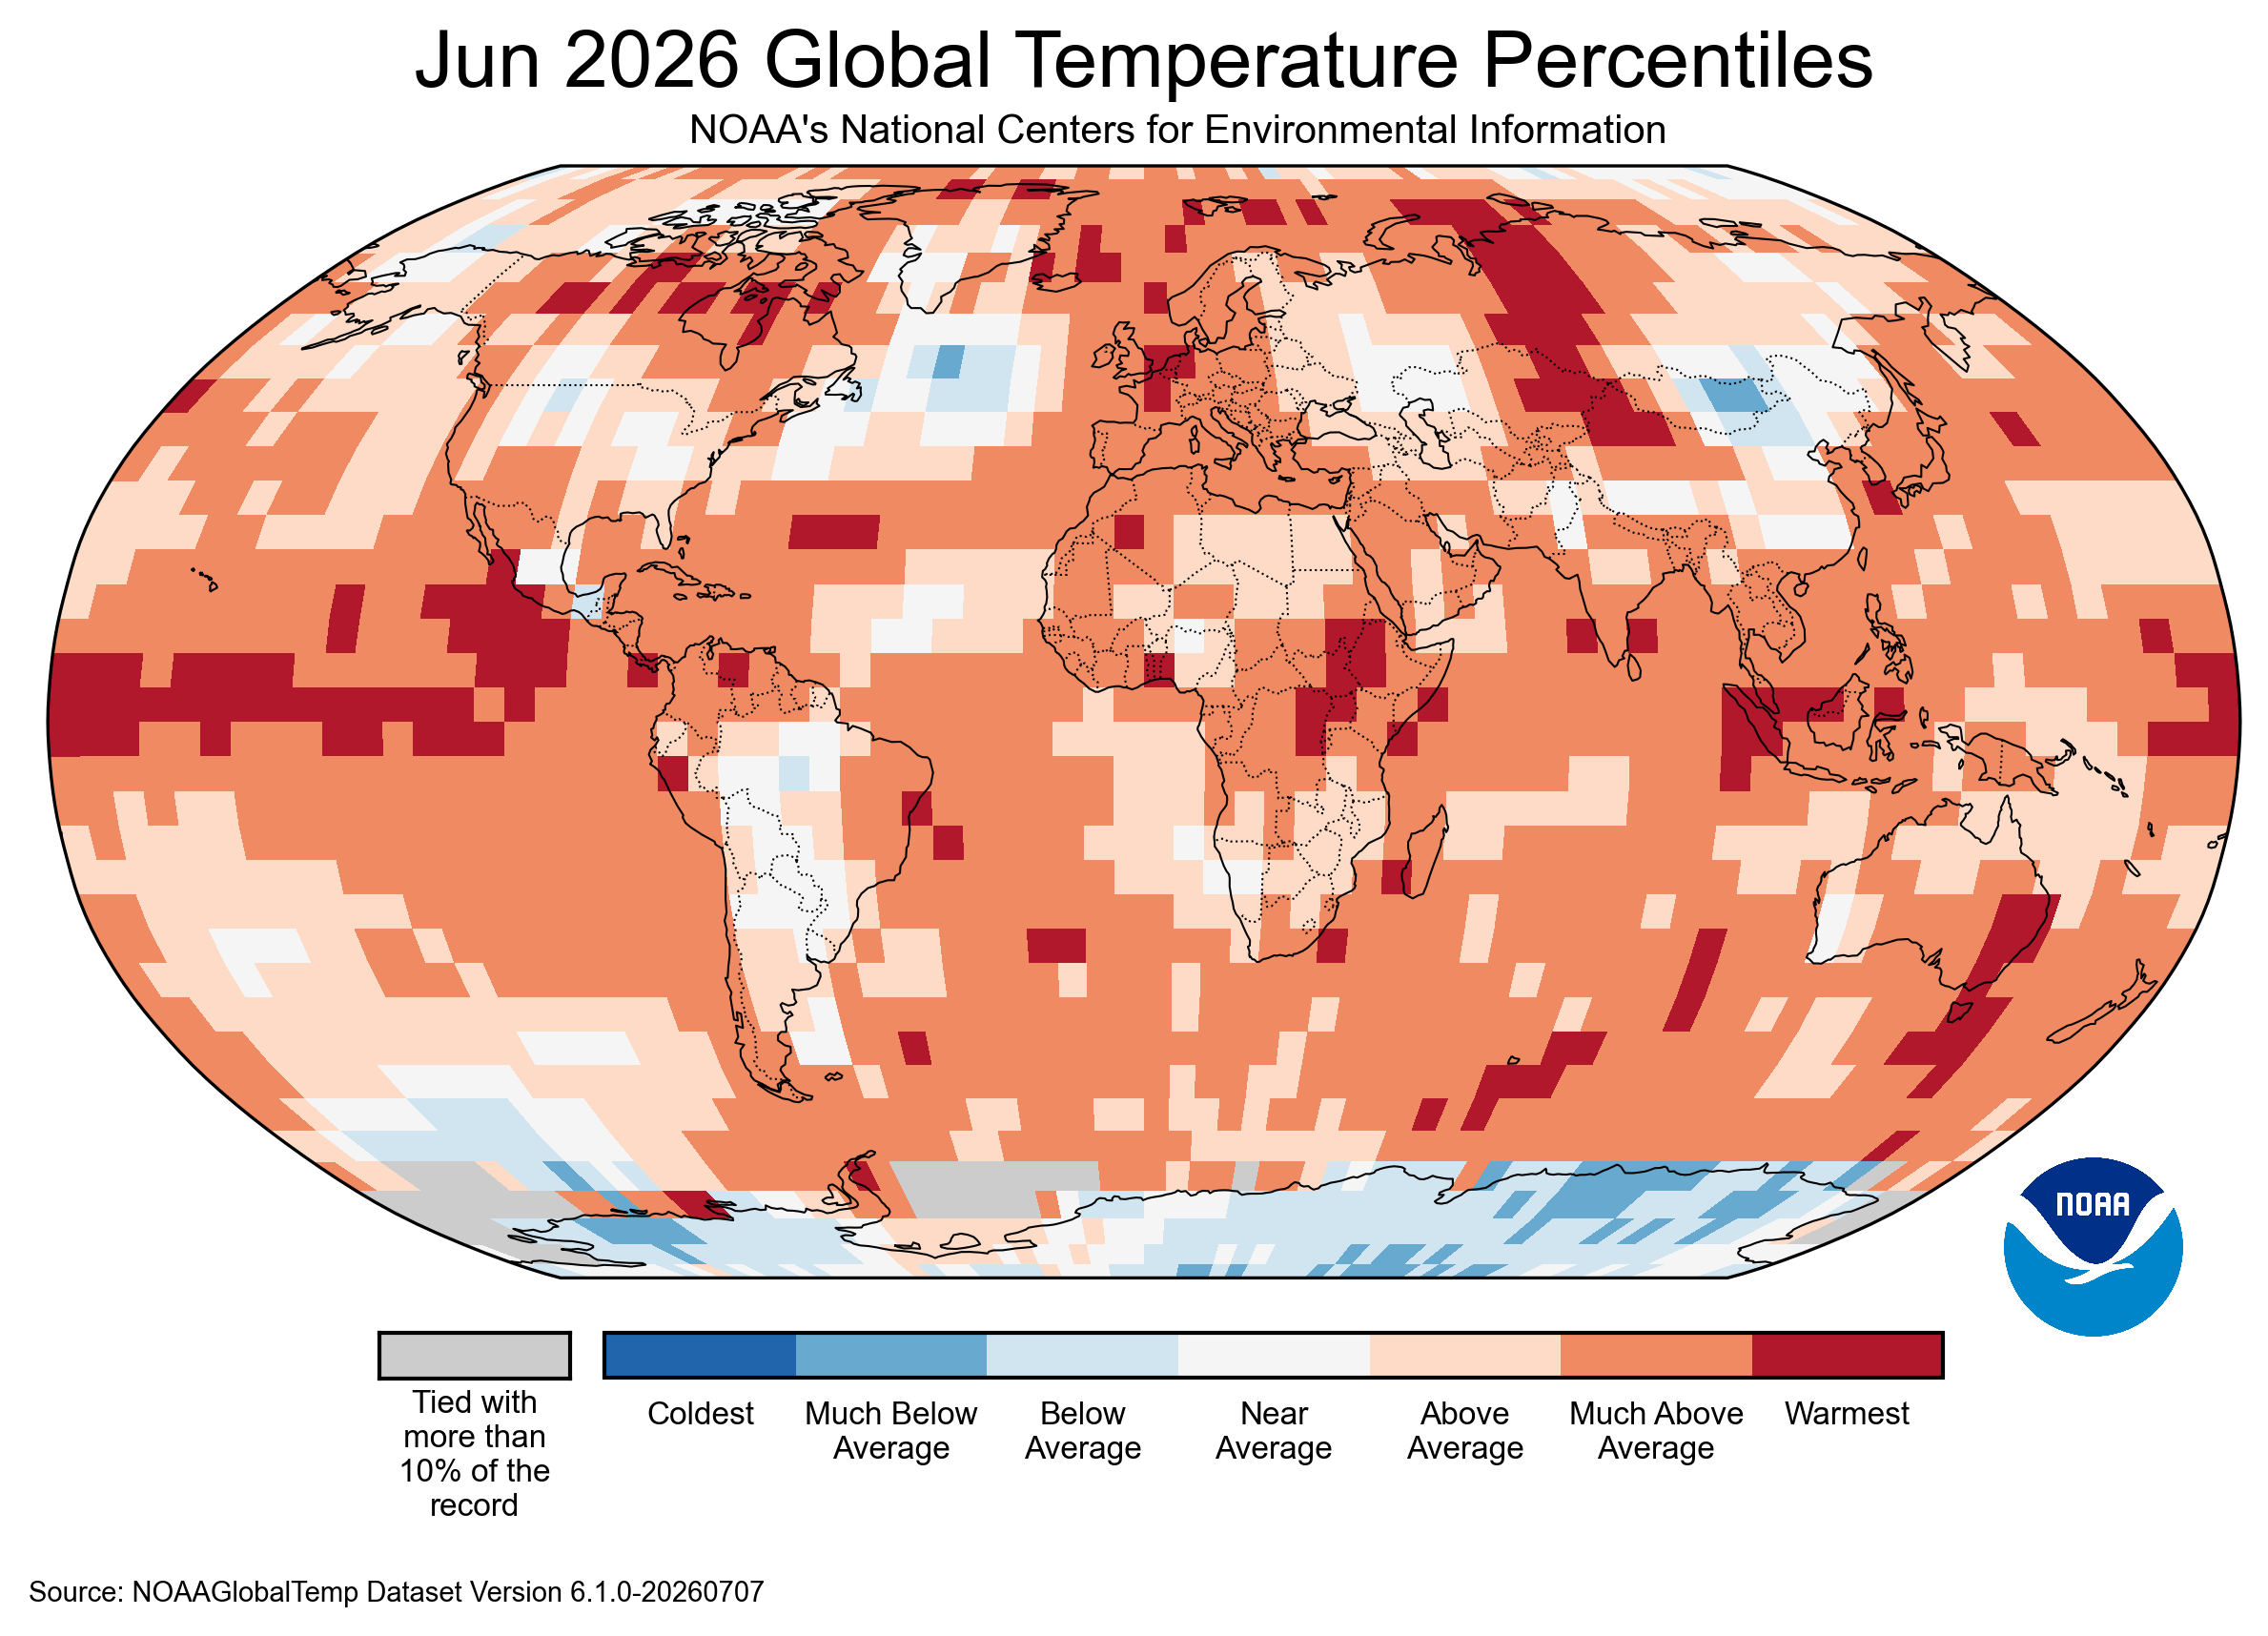
Before we dig into the details on Europe, here is a quick look at the global June 2026 temperatures from https://www.ncei.noaa.gov/access/monitoring/monthly-report/global/202606, from NOAA/NCEI, and like with the March 2026 temperatures from the blog entry about the heat wave, that was also an above average month in far more places around the world than with a below average month for temperatures. The map shows numerous areas, including in the tropical Pacific due to the very anomalously high water temperatures in our building El Niño.
One of the frequent characteristics of the heat dome is the relative lack of rainfall and dry soil. One can see how parts of Europe (especially around the Alps) had rainfall deficits of over 2 mm per day. This would equate to 60 mm/2.4 in. below normal for all of June. The same set of figures below show the substantially lower humidity and soil moisture over the region which had the heat wave. Dry soil heats up faster than wet soil, and with the unusually high amounts of solar radiation (due to fewer clouds but also at the time of year when, due to the long days, total daily solar radiation is higher at Europe's latitude than at the equator, and with a sun angle between 20 and 30 degrees from the zenith at noon), that will make the heating very efficient.
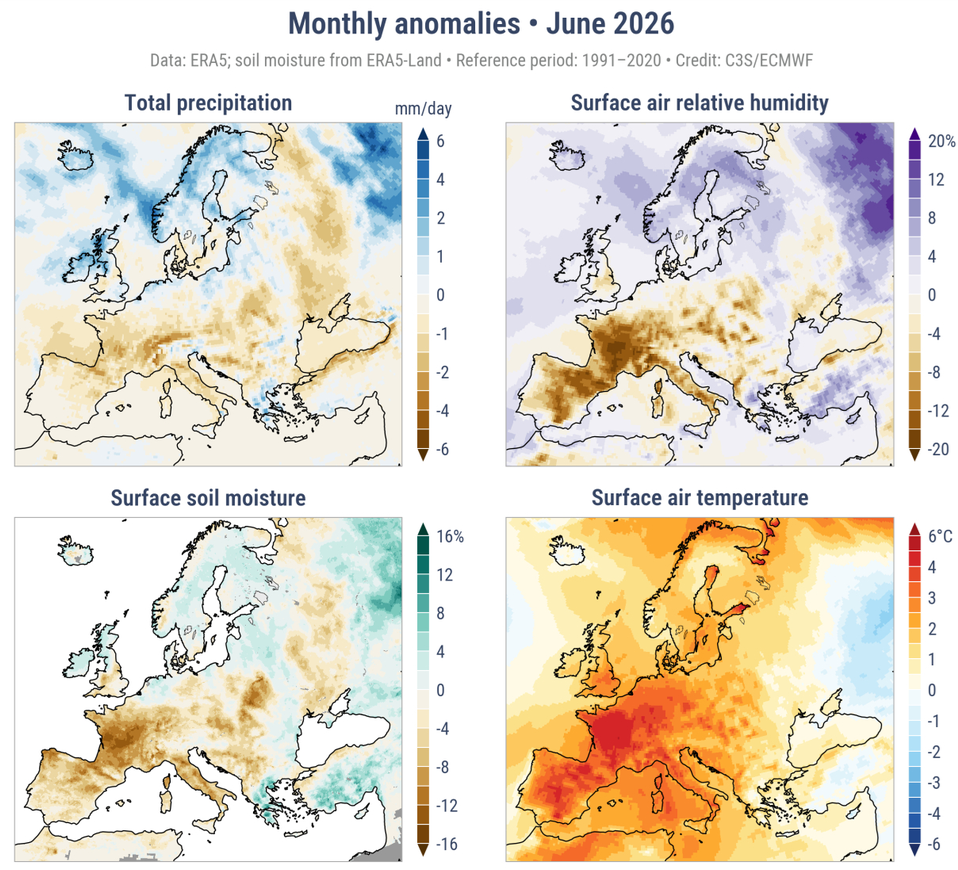
Source: https://climate.copernicus.eu/precipitation-relative-humidity-soil-moisture-and-river-flow-june-2026
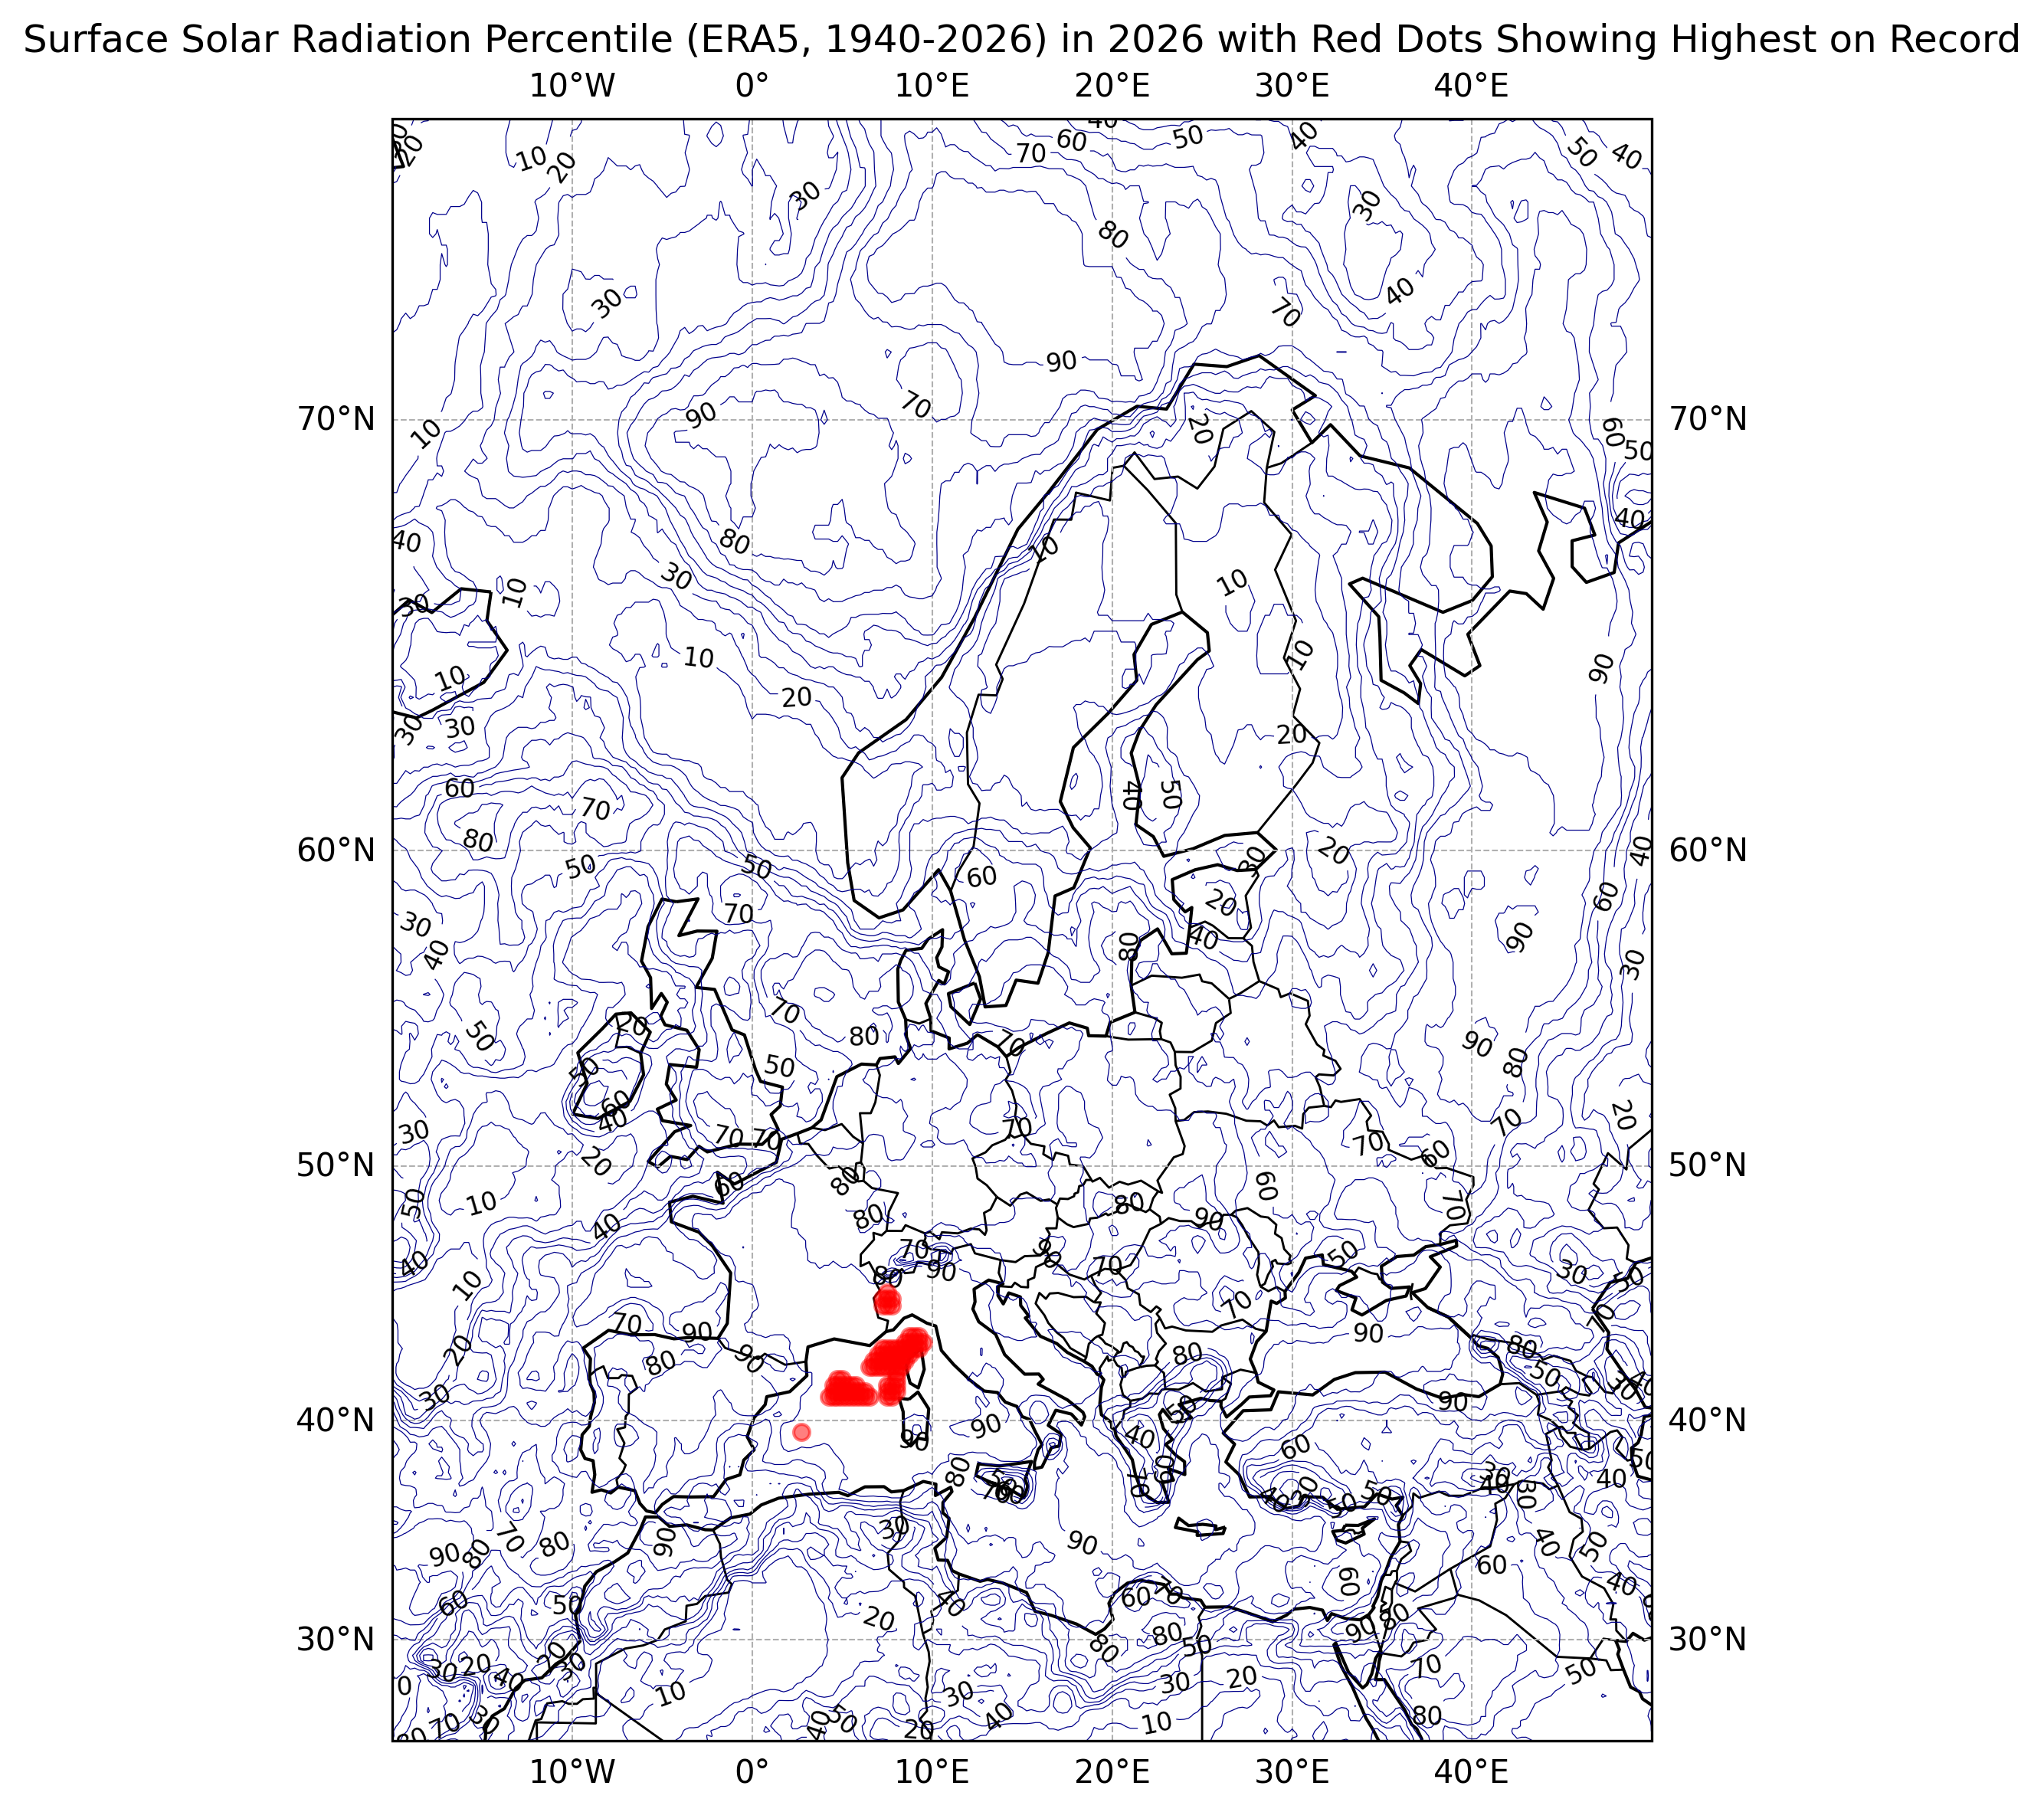
Here is the map of downward solar radiation expressed as a percentile for June 2026, compared with other Junes (ERA5 dataset from 1940 through 2026). While only a few locations had their all-time solar radiation for June in 2026, many areas of central and southwestern Europe were above the 80th percentile with some locations above the 90th percentile.
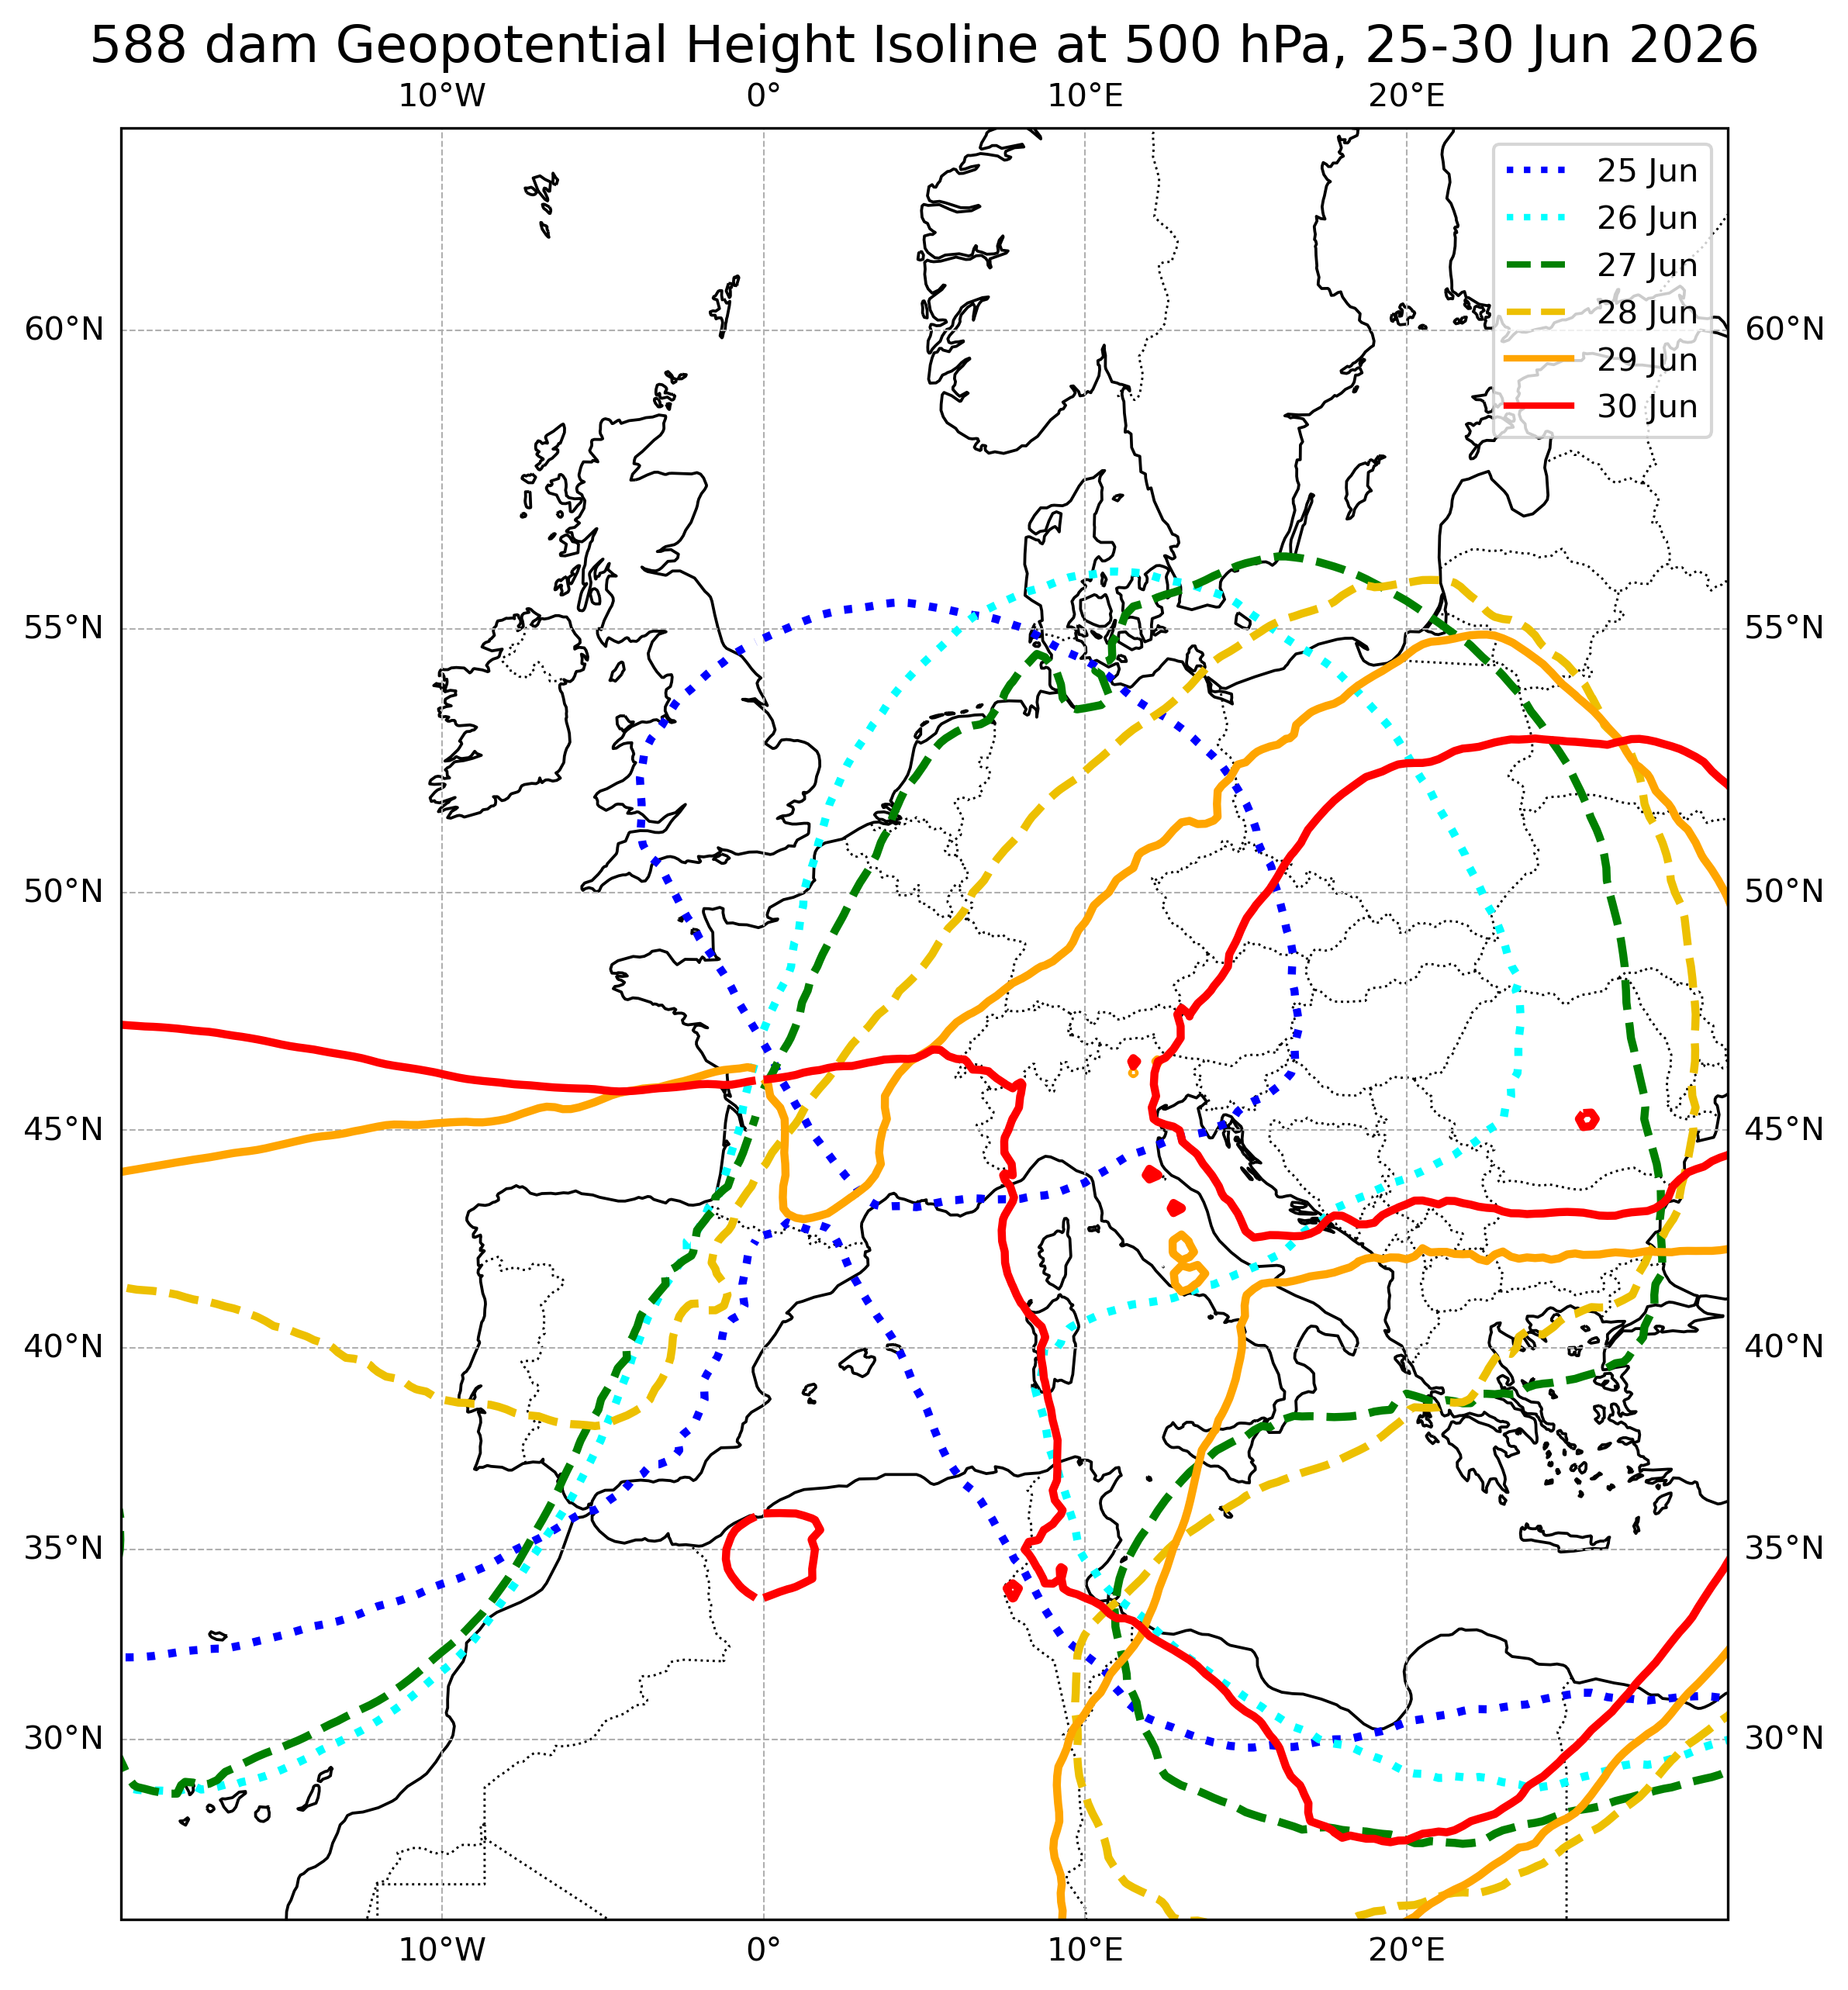
We will now look at the 500 hPa level, specifically 500 hPa heights (effectively how high you need to be in order to reach roughly half the atmospheric pressure at the surface), with values used by meteorologists typically in dekameters (dam), or tens of meters. In general, the 500 hPa level is between 500 dam (16000 feet) in a very cold air mass to around 600 hPa in a very hot air mass (technically the average temperature in the air mass will be based on thicknesses--how far about various pressure levels are, such as 1000 and 500 hPa). This is from the (NOAA) GDAS analysis. We will look at the 588 dam contour (associated with a very warm air mass for so far north) for 6 days at a time starting with 19-24 June to see how the upper ridge moved around (albeit slowly), and note that the connection to the hot Sahara is always there.
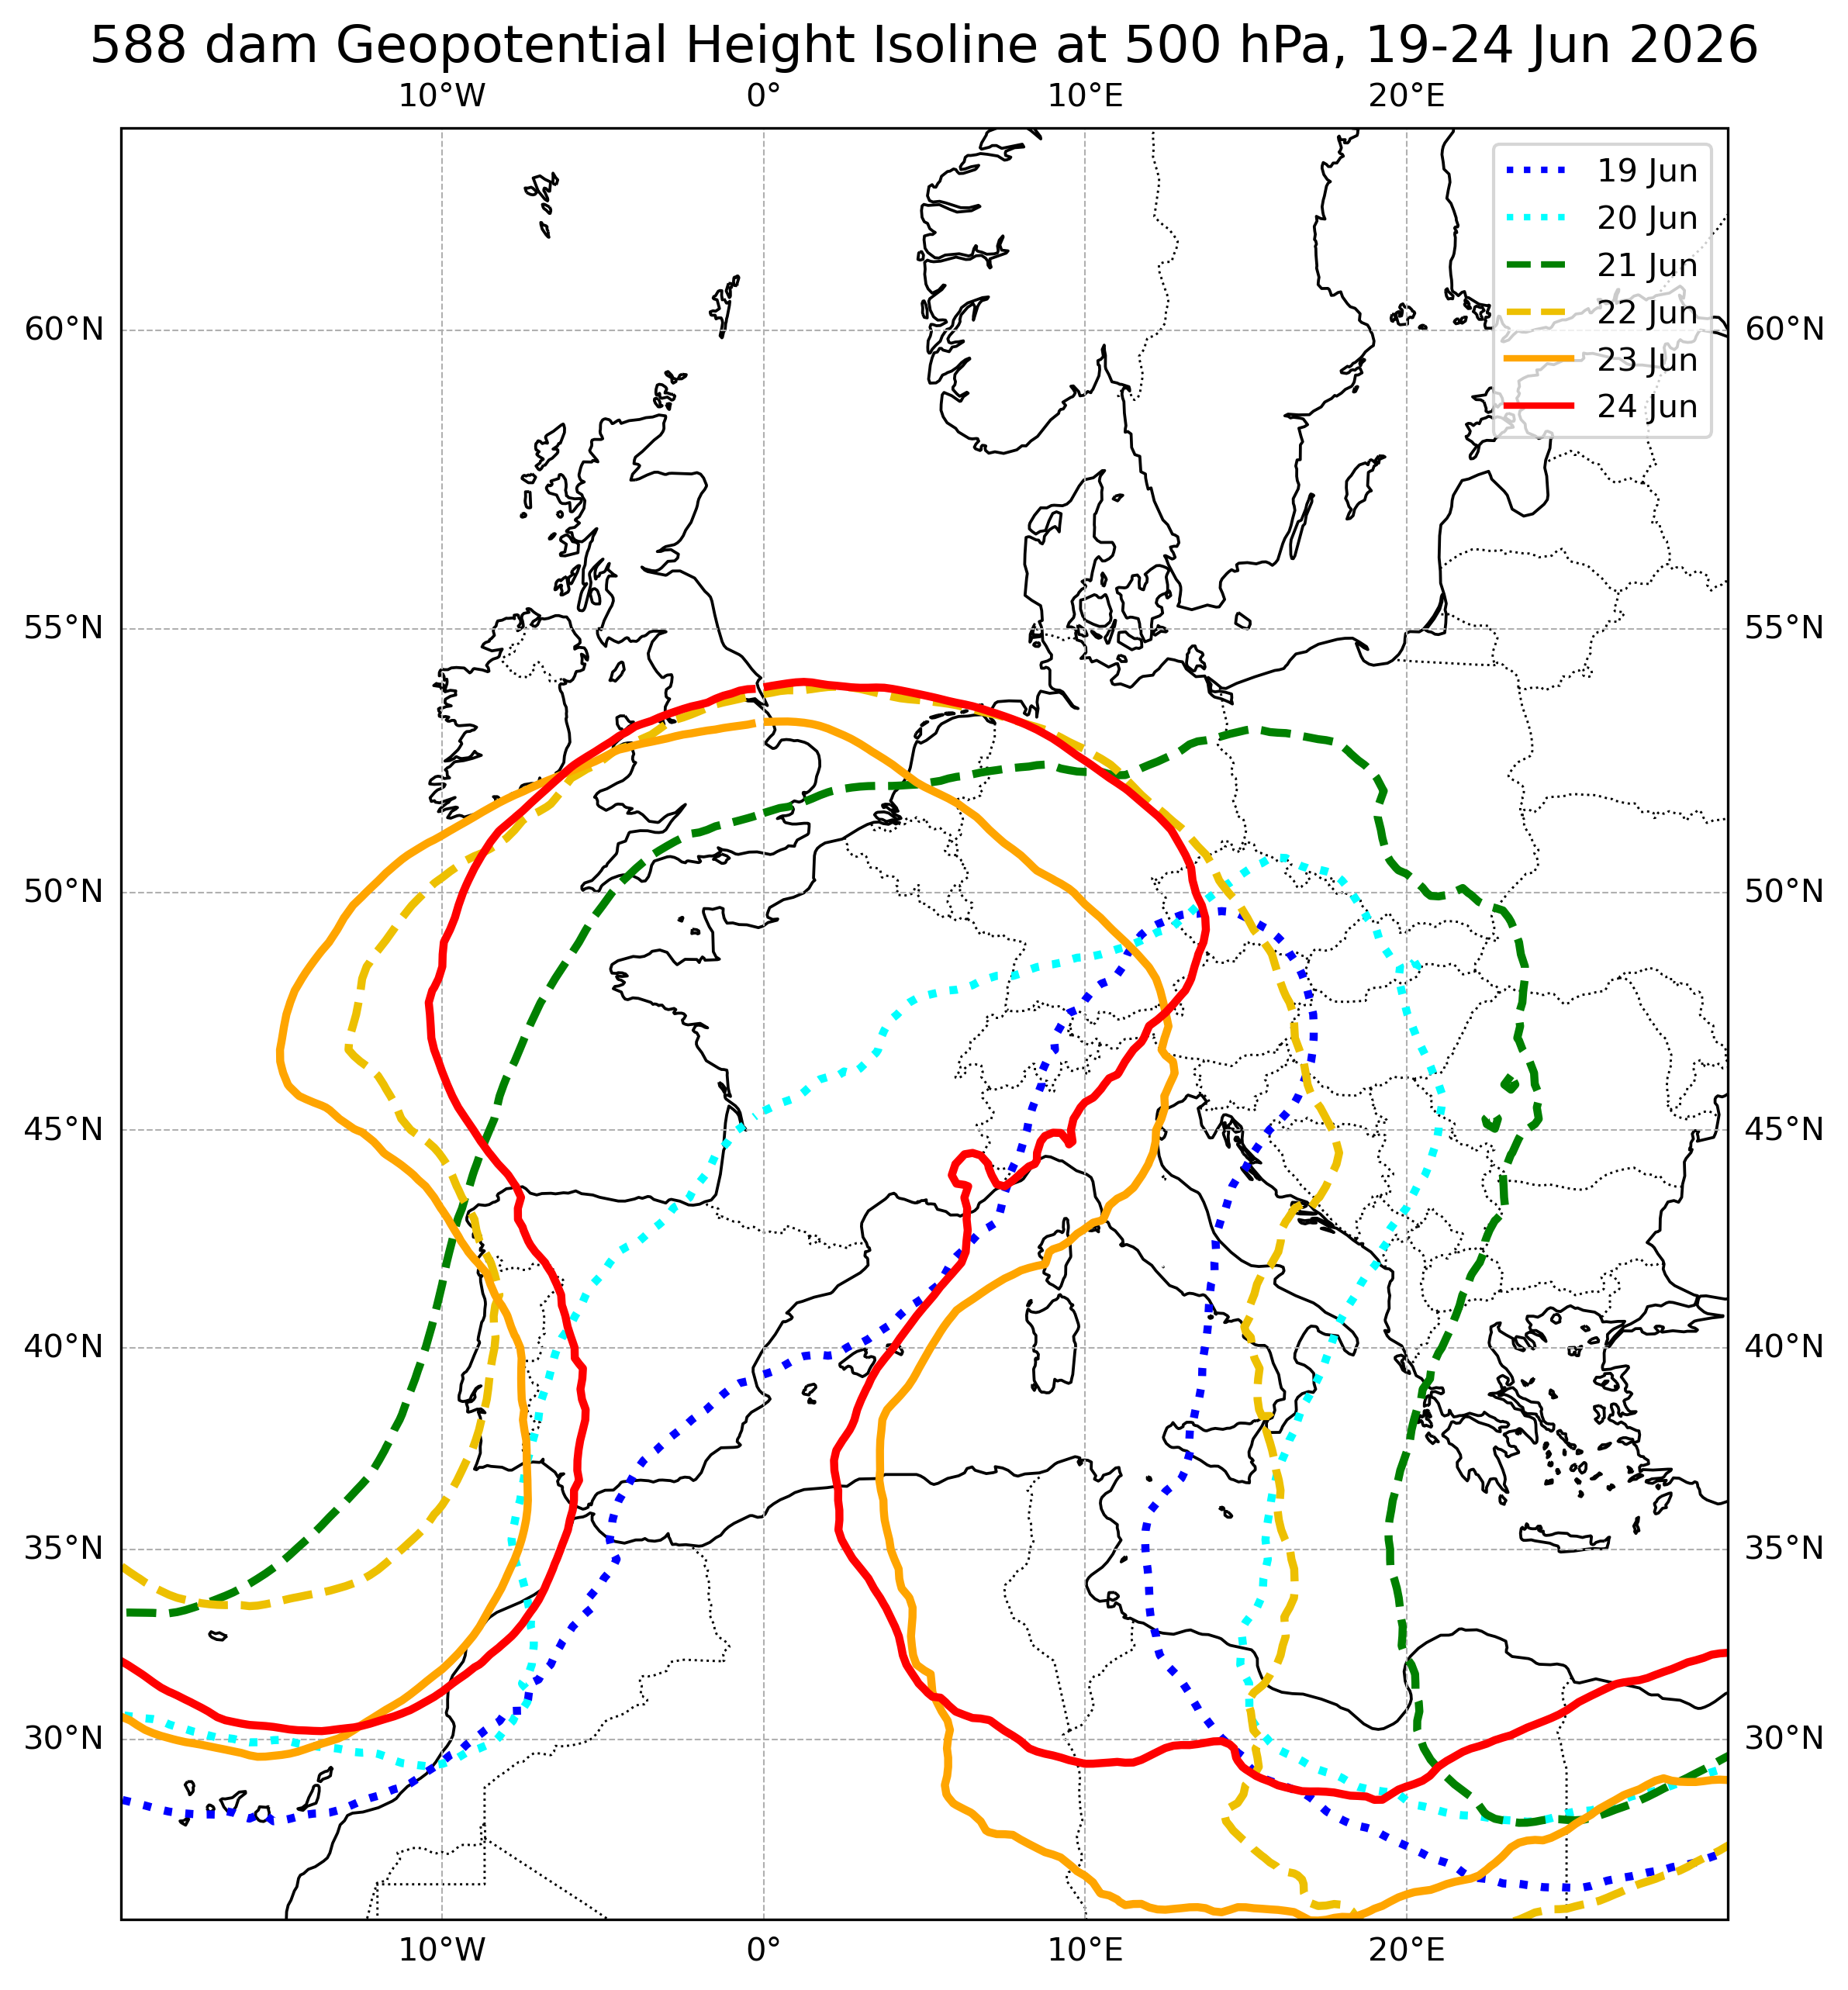
Towards the northern end of the high (England to Germany to Poland), there is a clear eastward progression of the high, which in these areas was followed by cooler air shortly thereafter. Farther south, the high meandered.
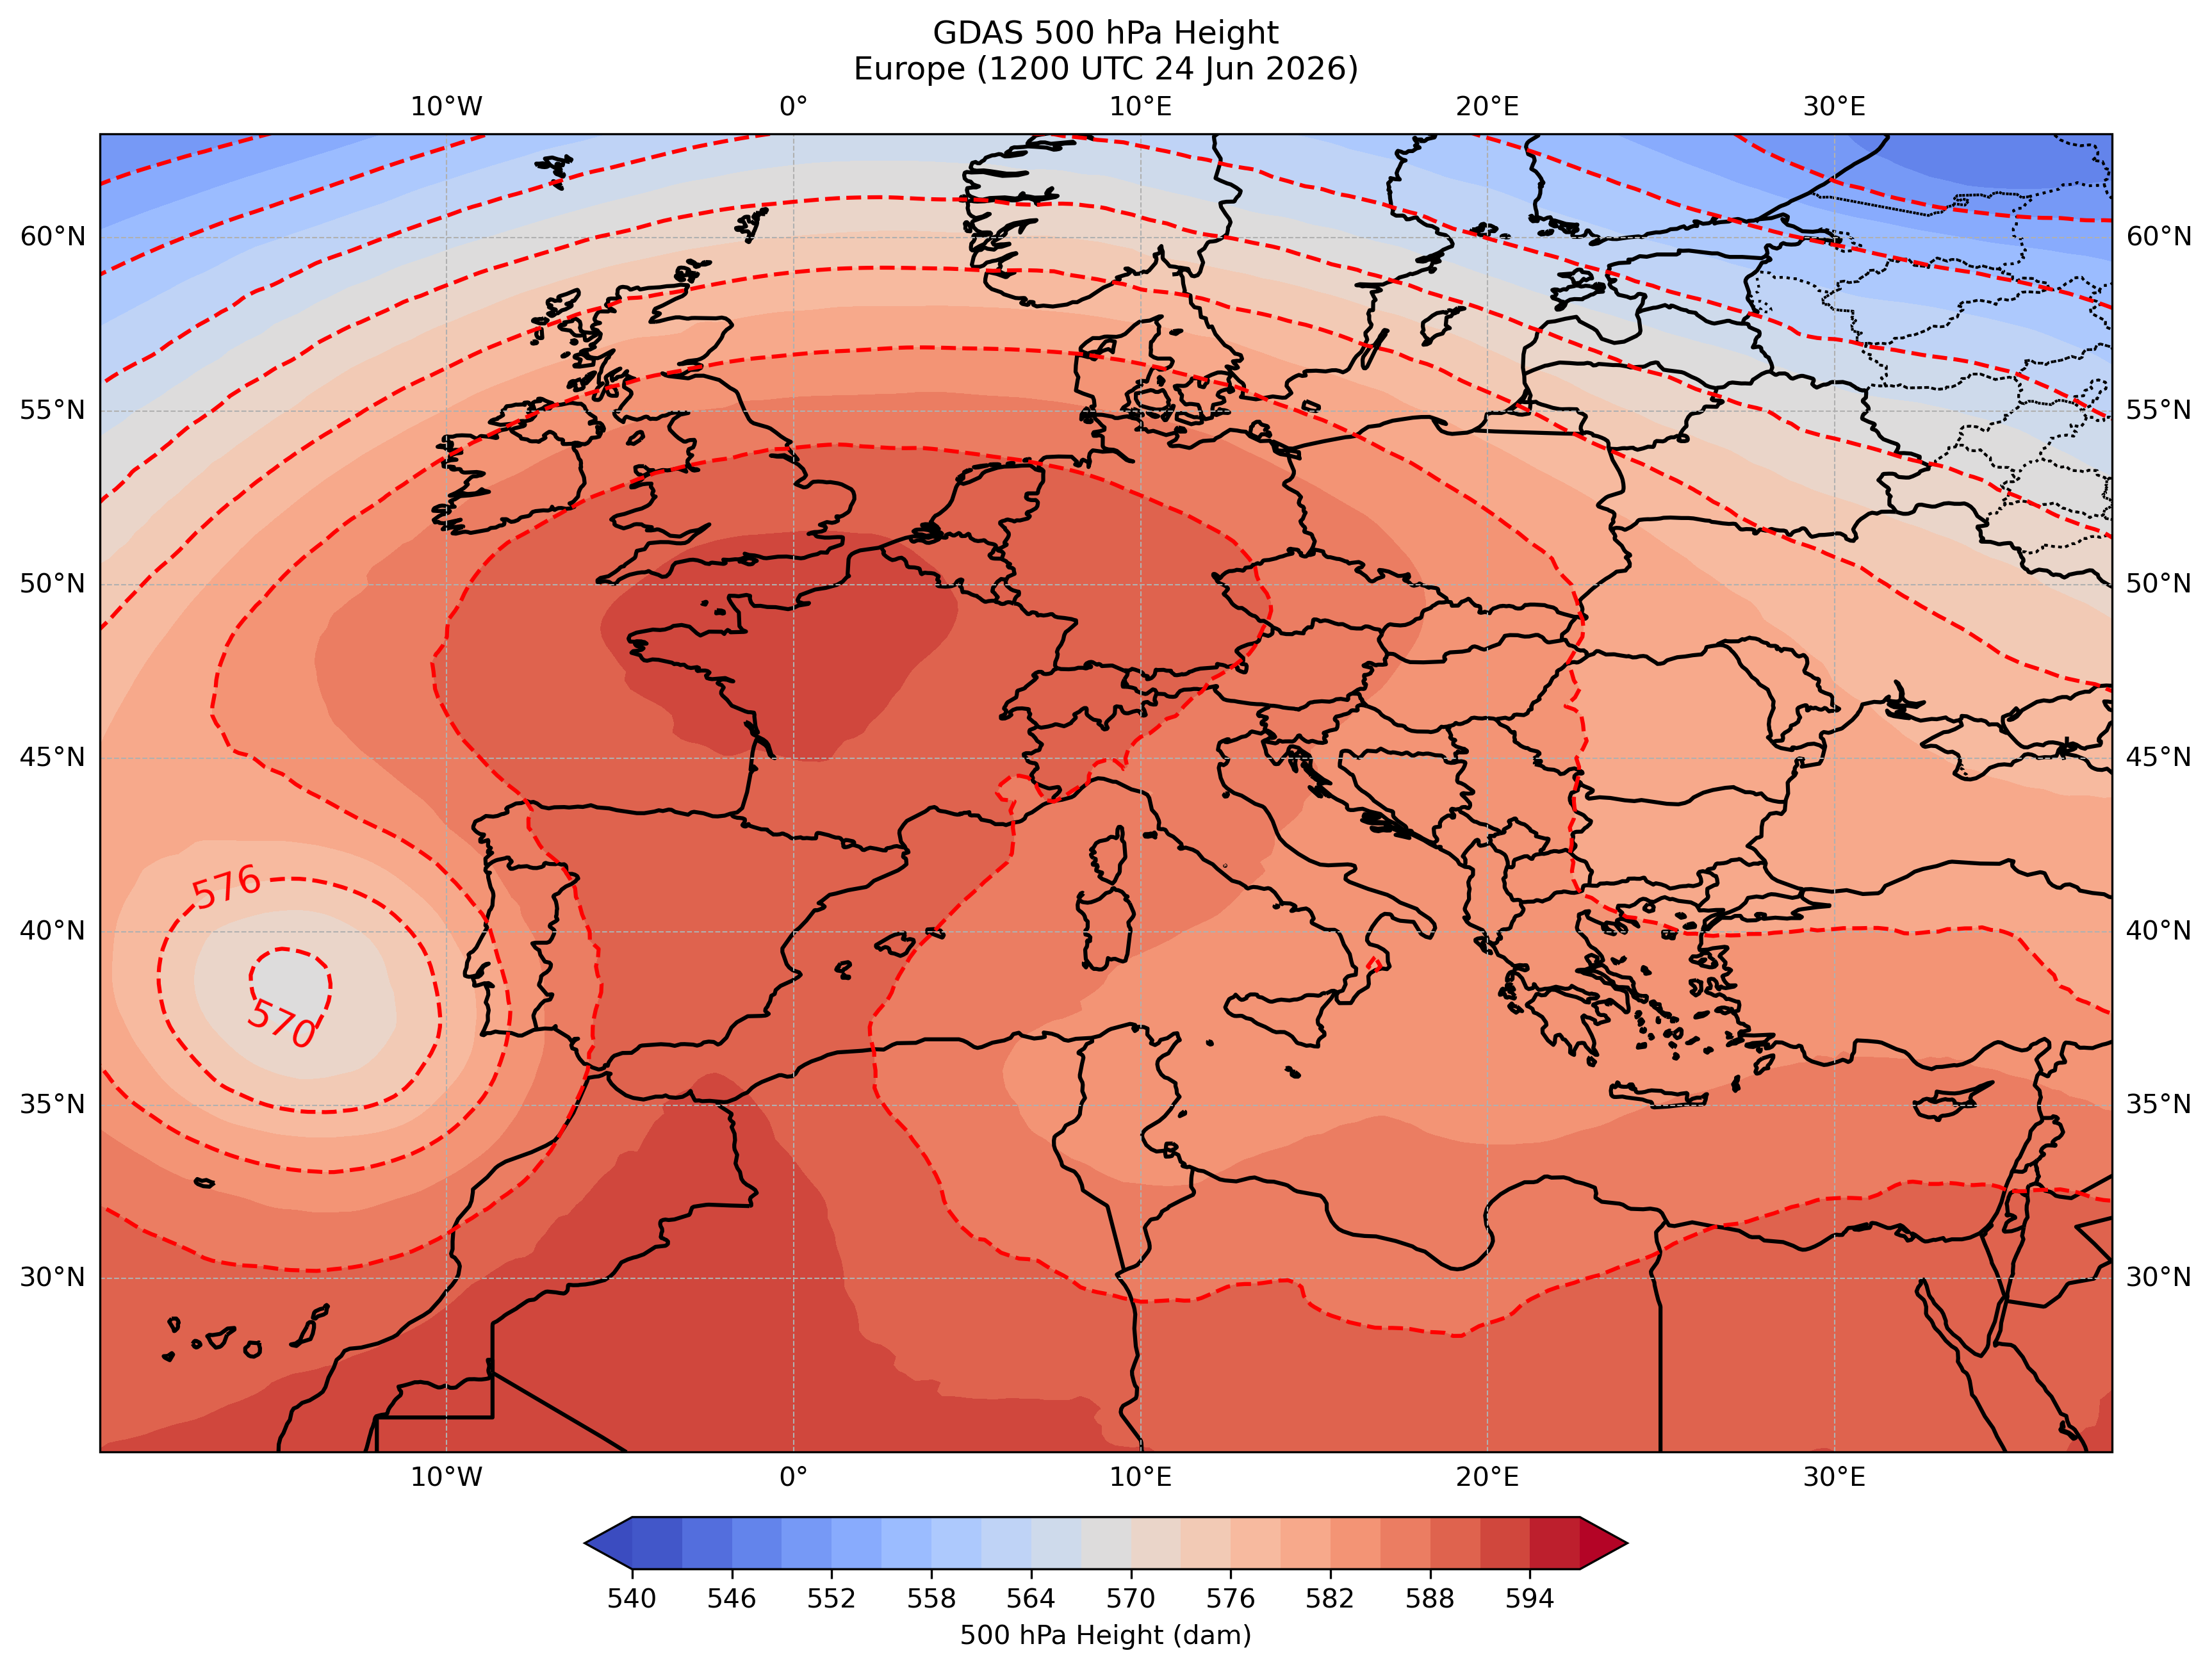
Looking specifically at 24 Jun 2026 when France, especially, was receiving very hot weather (including 40.9 C/106 F in Paris), we can see the 500 hPa ridge extending from Algeria north through France. Note that Portugal was having a cooling trend, which would bring some temperary relief to parts of Spain the following two days, due to an upper low off the coast, which actually helped to strengthen the ridge of high pressure farther northeast.
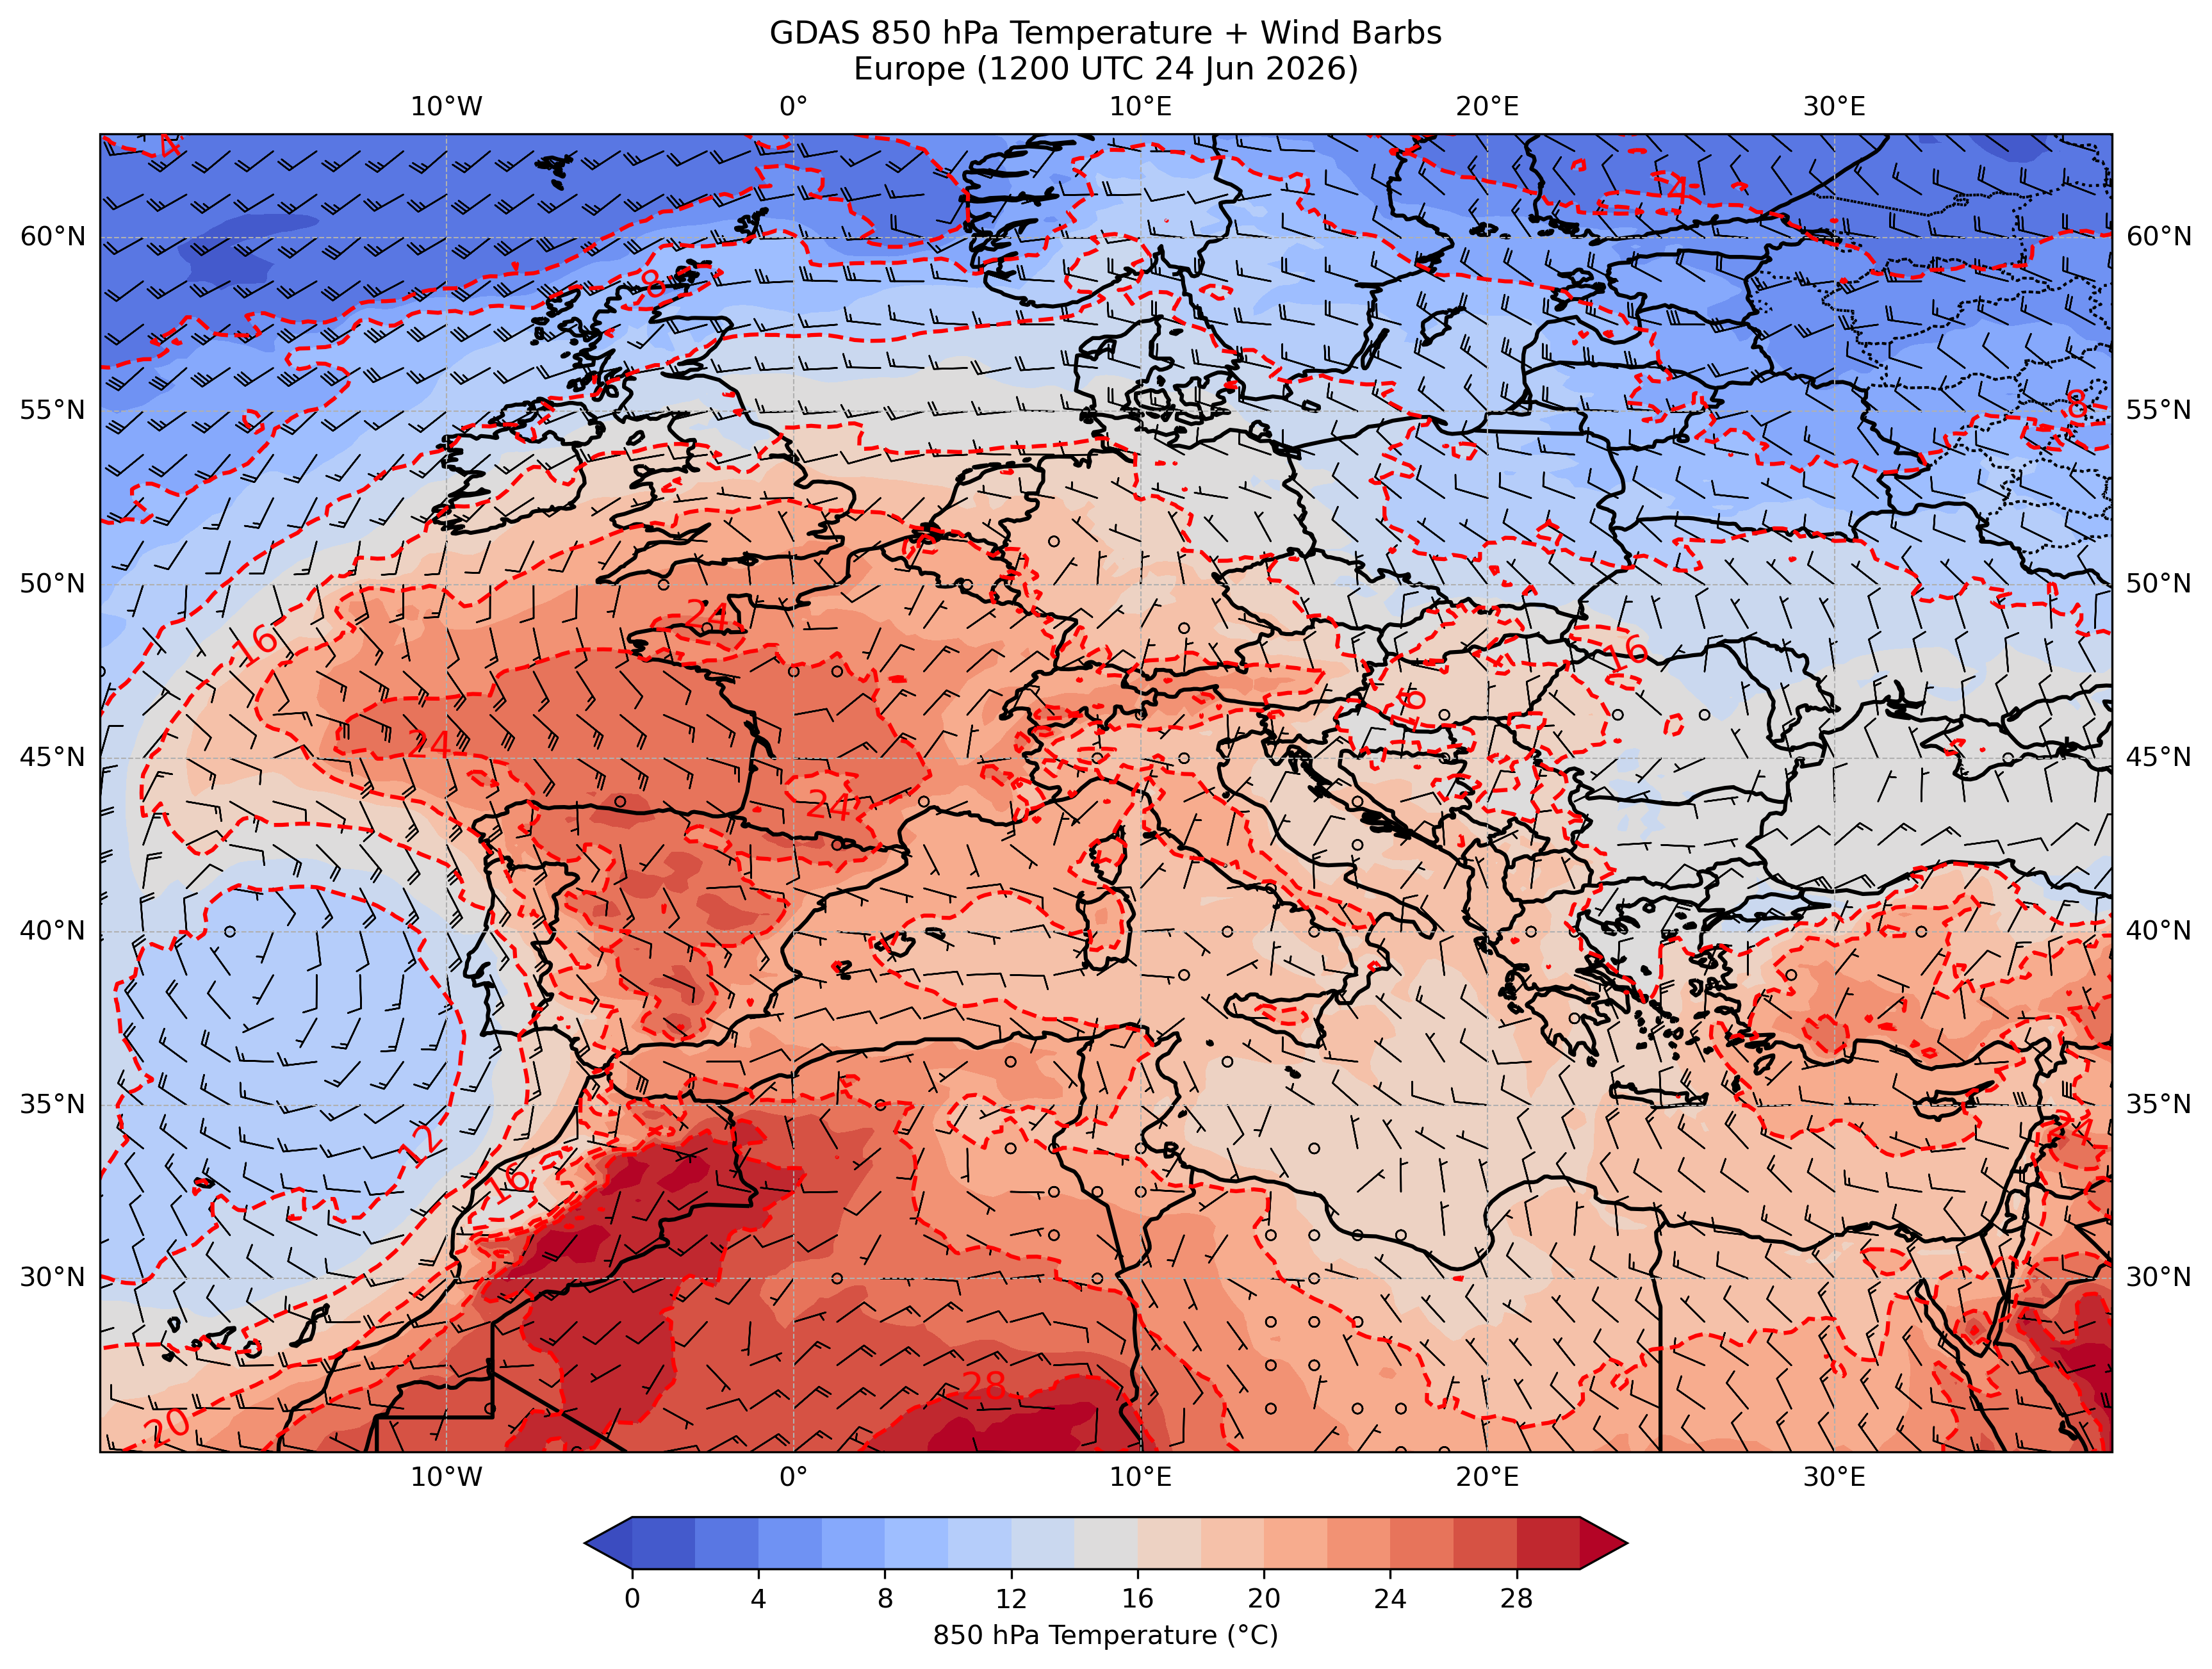
For heat domes, the 850 hPa temperature (usually a little less than 1500 meters/5000 feet above sea level) is often a very effective way to judge the air mass, especially with heat waves in summer where temperature inversions are less common below, unlike in winter when sometimes an air mass will be mild at 850 hPa but cold at the surface (often the case for freezing rain events). During heat waves, the daytime atmospheric sounding is often dry adiabatic or nearly so (9.8°C per 1000 meters) between the surface and the 850 hPa level (and often well above). Hence, the surface will be around 14°C/26°F warmer than at 850 hPa during the peak heating of the day. Note that there is an exception to the rule where downsloping Foehn winds, including the Santa Ana winds in Southern California, Chinook winds on the east slopes of the Rockies and Foehn (or Föhn) winds north of the Alps, as these winds create compressional heating which can result in surface temperatures well above what the antecedent 850 hPa temperatures would produce (though downwind from the mountains, the 850 hPa temperatures increase as well). Foehn winds can exacerbate conditions in a heat dome (we will see a quick example of downsloping winds with this heat wave below in Bilbao, Spain), though Foehn winds are more common outside of summer since mountain waves, which provide strong support for the Foehn winds, are more prevalent during the cooler months (potential future blog topic!). Regardless, here is the 850 hPa temperature map (with winds added) for 1200 UTC 24 Jun 2026 (using the same GDAS analysis as with the 500 hPa heights), showing 850 hPa temperatures exceeding 24°C in many areas of southwestern Europe, as well as a lot of synoptic-scale easterly wind, partly due to that upper low off the coast of Portugal:
Let's look at the temperature graphs during this period for selected cities in southwestern and central Europe. We will start out with Bilbao, Spain, in the Basque Country of the north near the Bay of Biscay, using the NOAA/NWS Weather and Hazards Data Viewer.
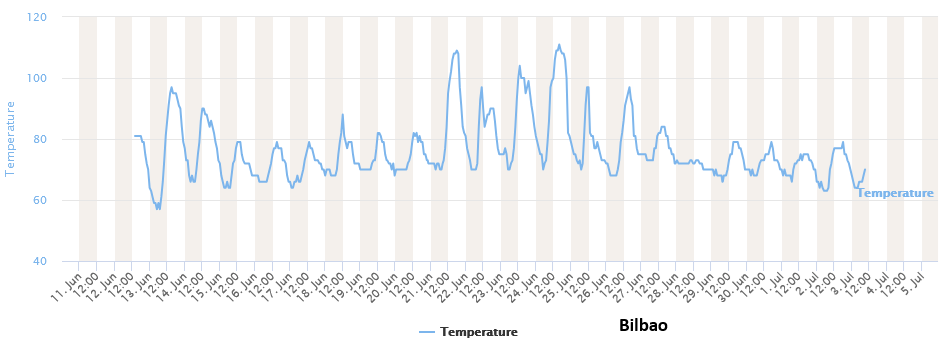
There were two days which were particularly hot: 21 Jun 2026 when the temperature at the airport reached 43 C/109 F which at the time set an all-time June high temperature, and 24 Jun 2026 when the temperature tied the all-time high temperature of 44 C/111 F (at least based on airport readings). Bilbao is usually cool in June with the average high of 24 C/74 F. Let's look at that 850 hPa temperature map for 1200 UTC 21 Jun 2026 (2 PM CET, though note that is around the solar noon there given their far westerly position in CET and with clocks shifted an hour later for summer time, the European terminology for DST).
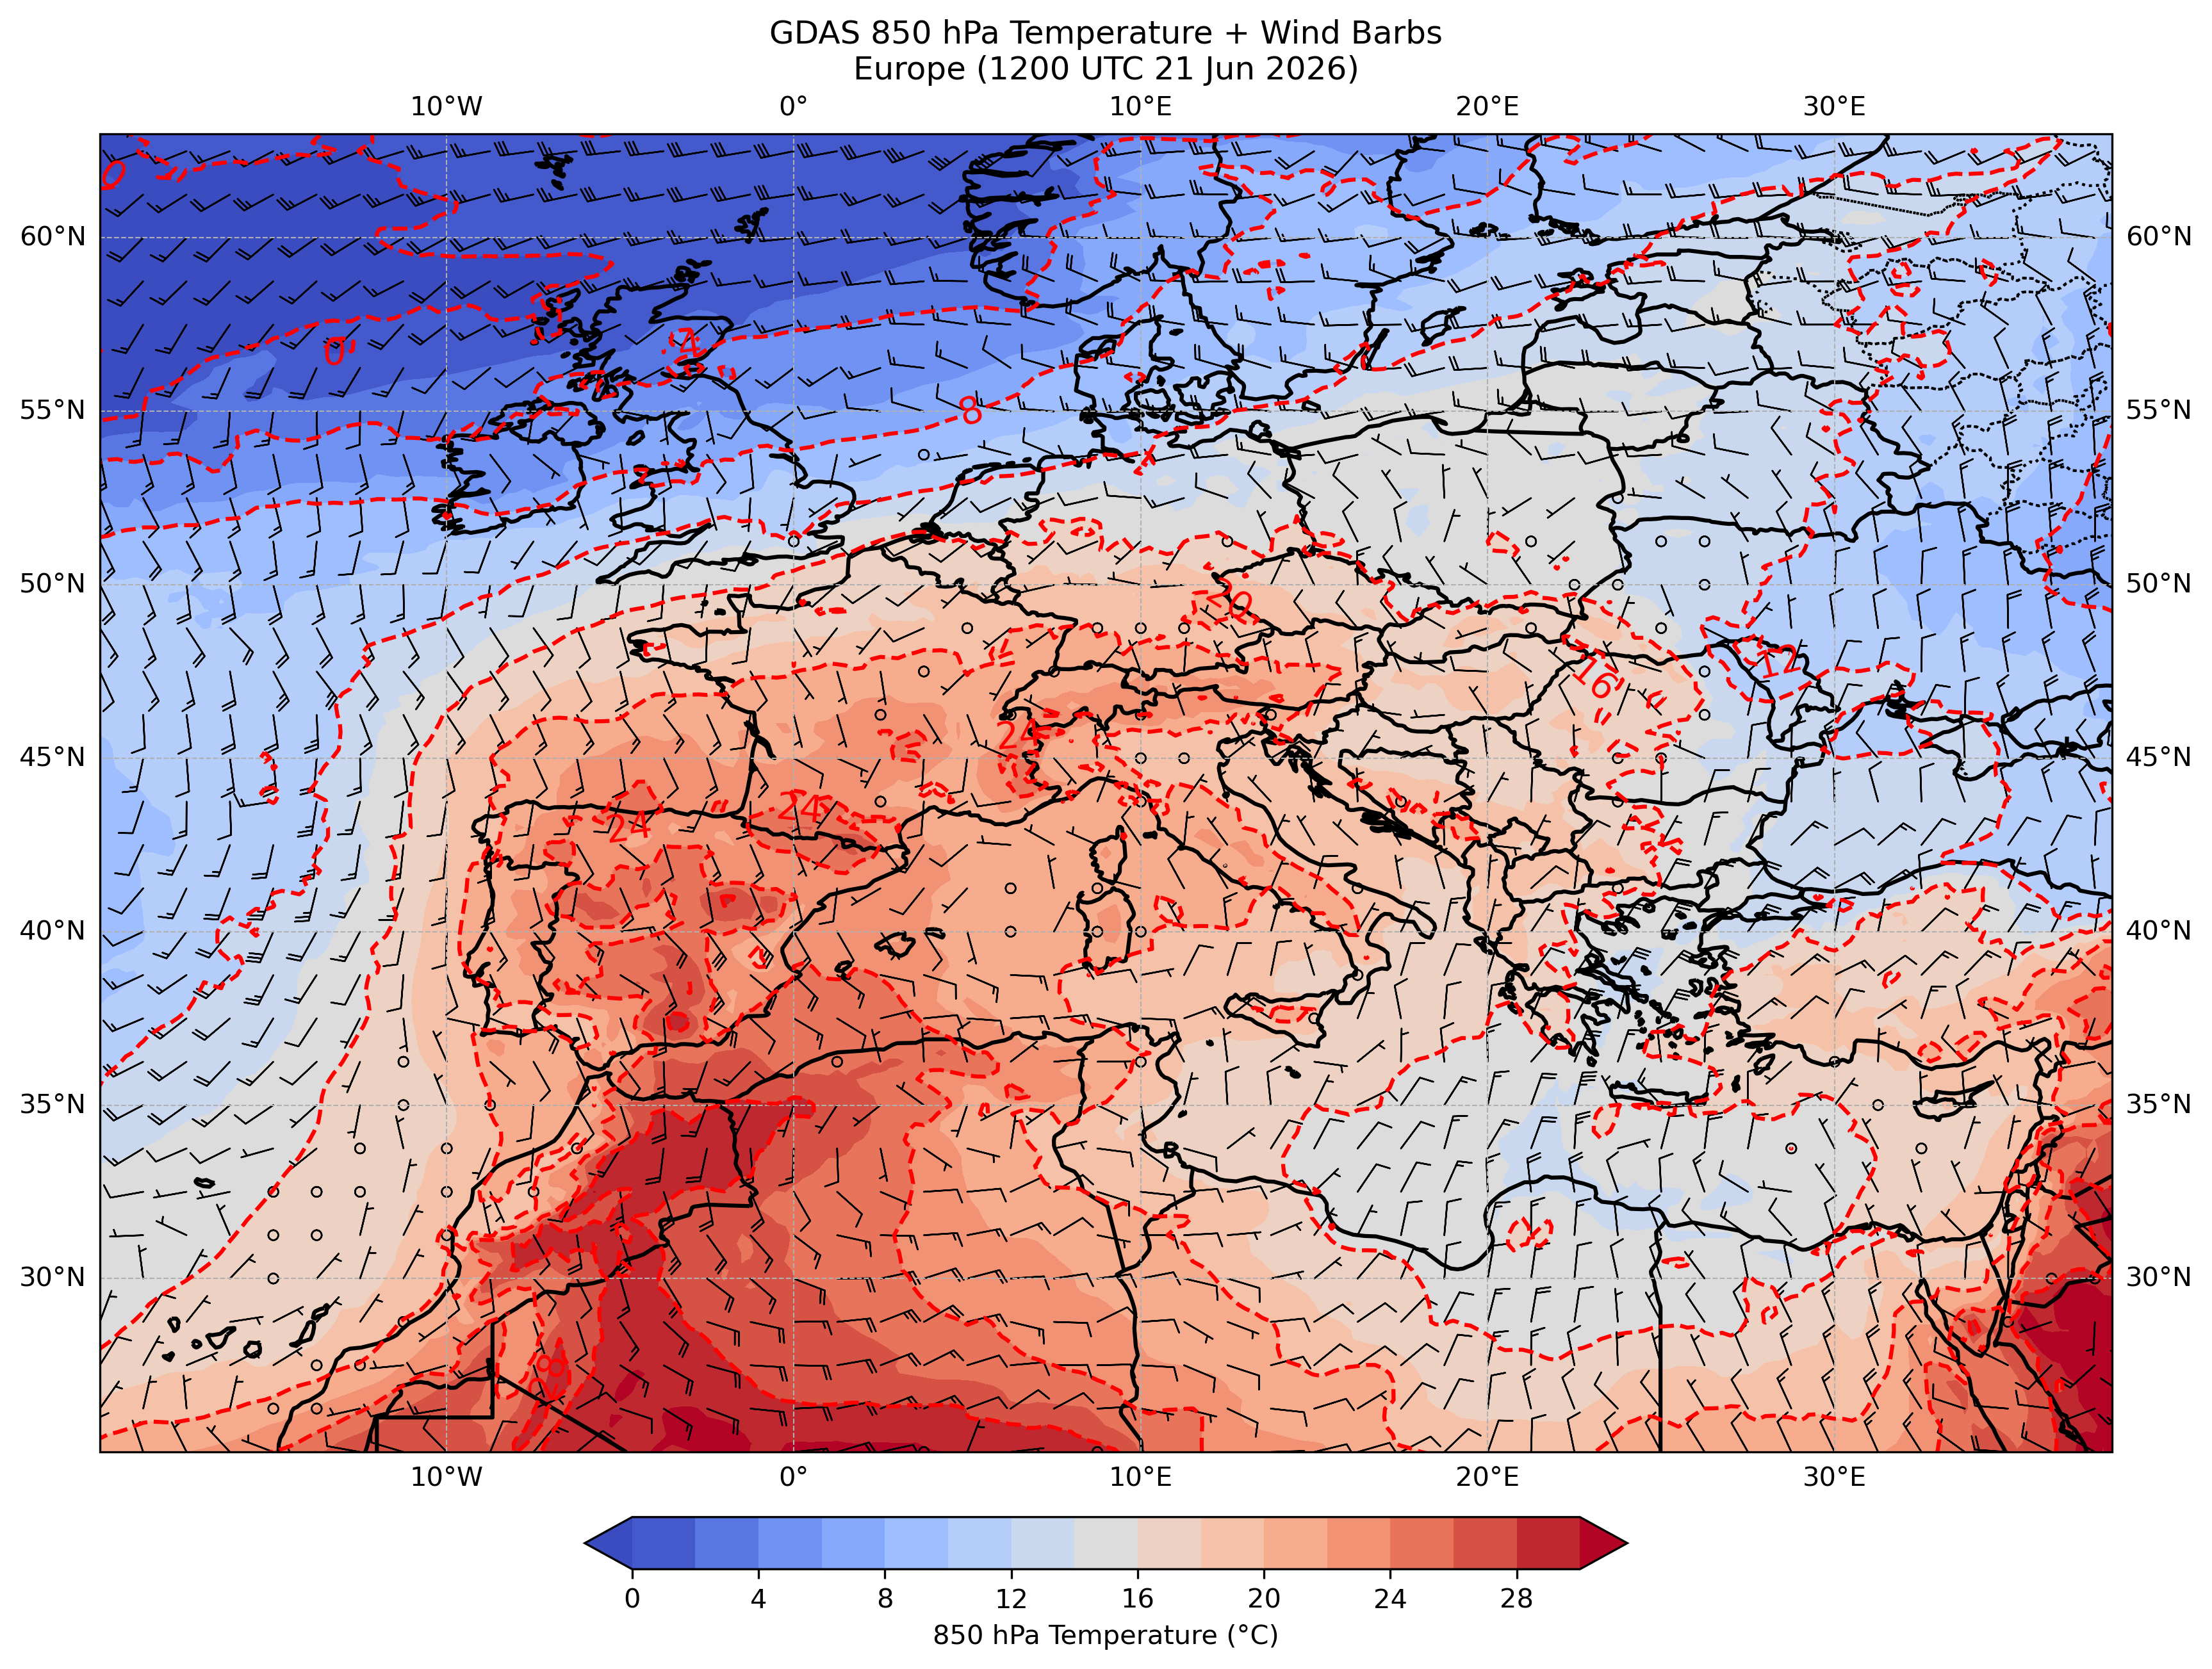
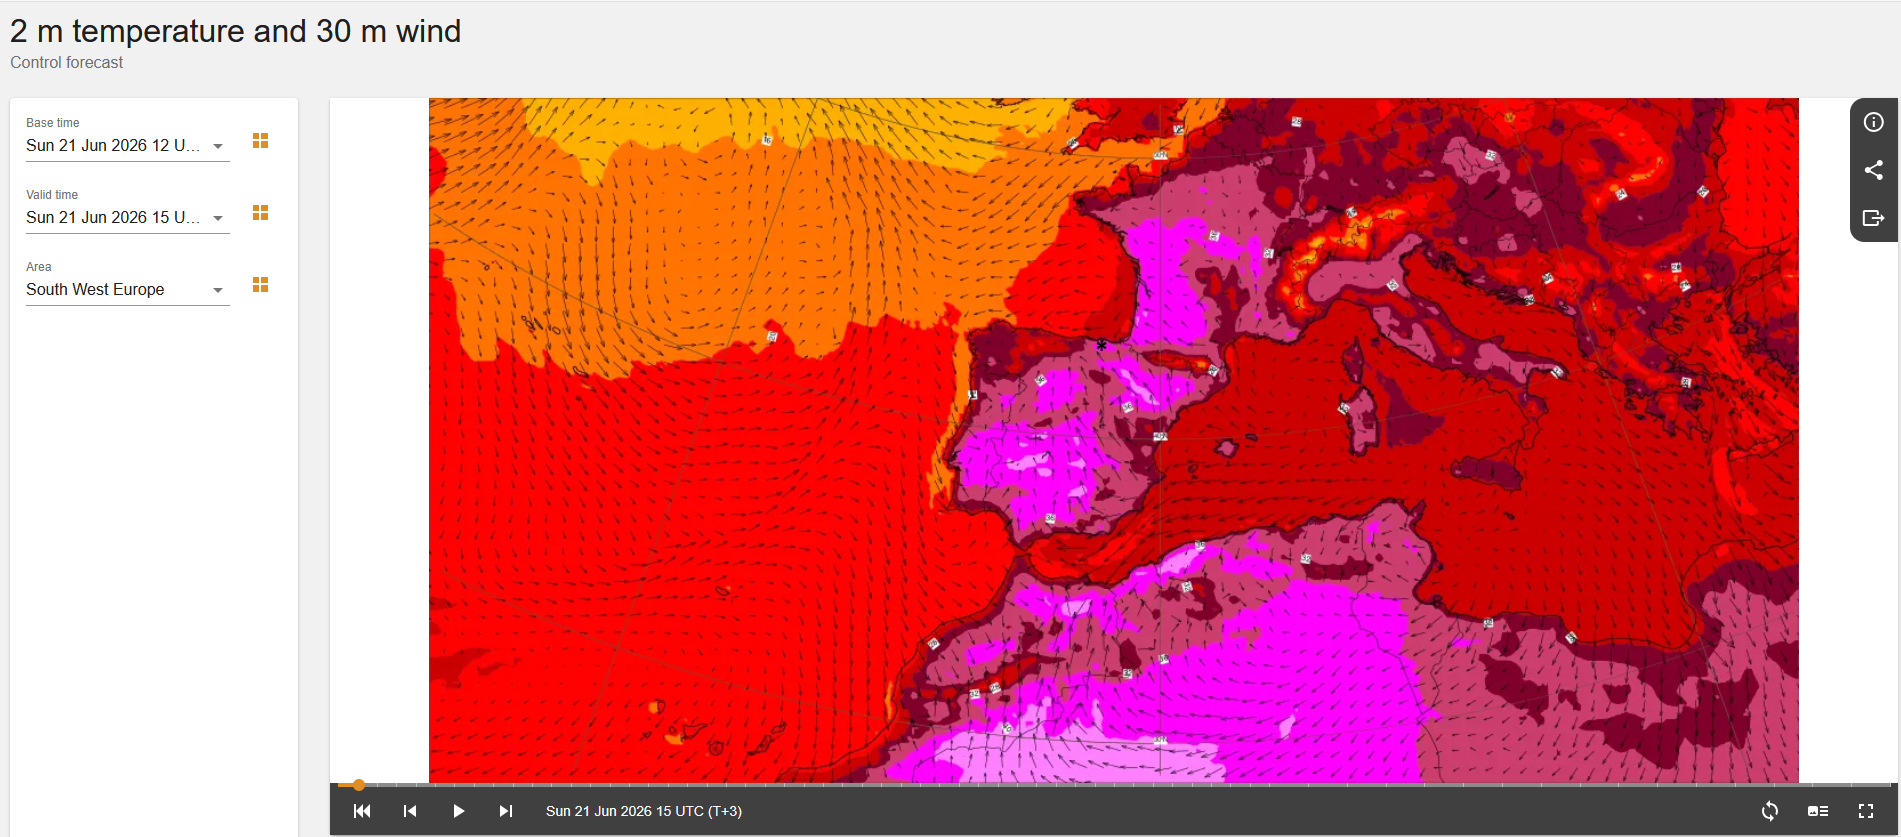
850 hPa temperatures were around 24 C, which would be equivalent to 38 C (at least on a large scale) if brought down to sea level (which valley locations in Bilbao are almost at sea level) or 100 F. But the high was around 5 C/9 F higher! Thus, some compressional heating likely occurred from the mountains to the south, southeast and east, which are not that high (mostly 600-1200 meters/2000-4000 feet above sea level) but yet high enough that the south to southeasterly flow (which can be seen at 850 hPa and the surface, which has more of an easterly component) would descend and compress, especially down into the NW-SE oriented Nervión River valley. Winds during the peak heat of 21 Jun 2026 were from the east to southeast at 10 to 15 MPH (17 to 25 km/hr) at the airport. Similar winds occurred at peak heat of 24 Jun 2026, except with more easterly component. The ECMWF surface wind map (for 1500 UTC/5 PM CET 21 Jun 2026) shows this flow. A small asterisk has been placed where Bilboa, Spain is referenced.
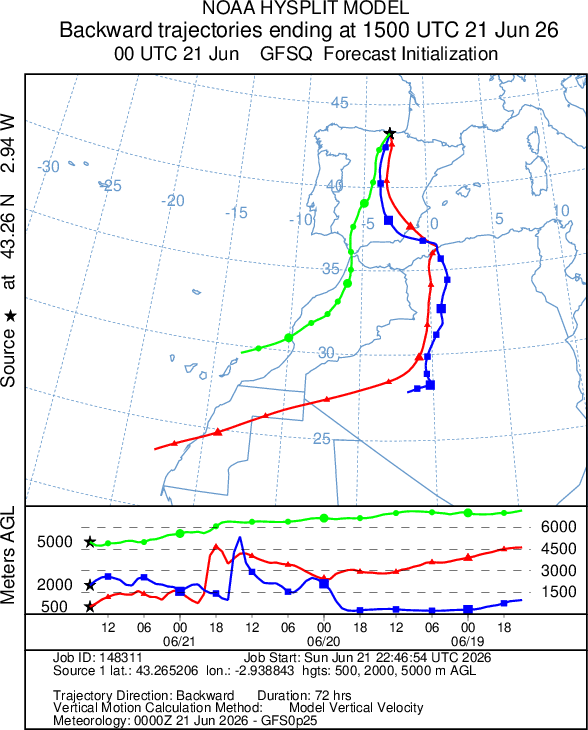
One of my favorite tools to view the where the air mass comes from is the backwards trajectory map. Instead of following the wind forward from a point of origin, one can trace back color to the source of the air mass using the NOAA Hysplit model. Doing that for Bilbao, Spain (selecting 3 points aloft, one at 500 meters/1600 feet above the surface (at the end point), one at 2000 meters/6500 feet, and one at 5000 meters/16000 feet to get a mix of readings and going backwards up to 72 hours) on 21 Jun 2026 shows both the 500 and 2000 meter backwards trajectories covered a lot of Algeria, which had been consistently hot (some areas over 43 C/110 F for daily highs) around that time. Especially when there is a low pressure system to the west or northwest, heat waves over southern Europe originate from the Sahara Desert. You can also see the subsidence on the timeline (latest time on the left) as the end of the trajectory at 500 meters was modeled to be at almost 1500 meters just 3 hours earlier.
Let's look at a few more sample cities, such as Berlin, Germany (Schönefeld Airport):
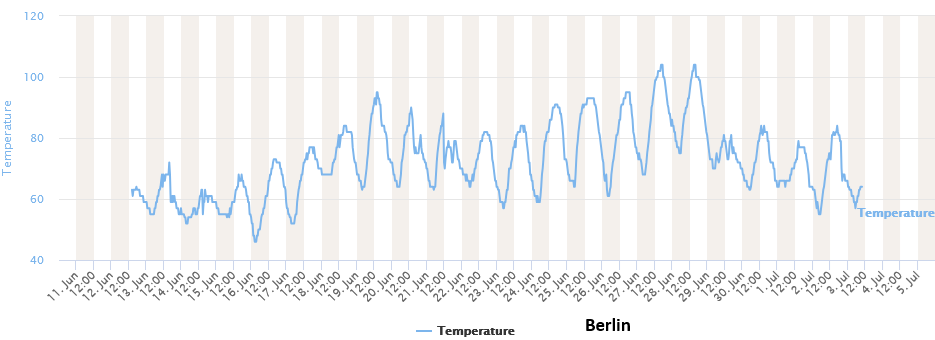
27 and 28 Jun 2026 were the hottest days (though thankfully for them, cooler air moved in from the north to end the extreme heat on 29 Jun 2026). Given they are farther removed (farther north) from the Sahara, let's view a greatly contrasting backwards trajectory map (same as before, 500 m/2000 m/5000 m are the ending point altitudes above ground level, and with a 72-hour period, but in this case, ending at 1200 UTC 27 Jun 2026).
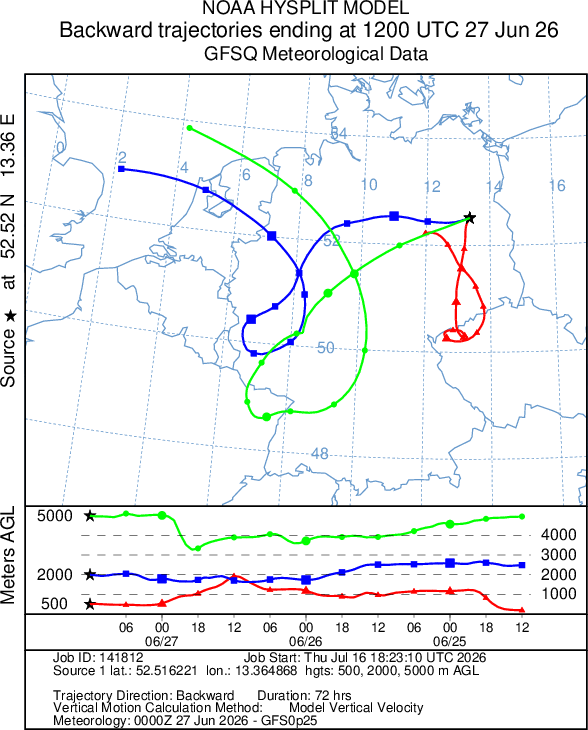
Sometimes with an upper high like this, you don't have a lot of movement in the air, and this is obvious as the trajectory ending at 500 meters was in the vicinity (no farther away than NW Czechia) for the previous 72 hours. One can see a lot of subsidence (without terrain effects) as the 500 meter air parcel was at 2000 meters just 24 hours earlier, and subsidence is a major characteristic of heat waves as the air aloft warms at the dry adiabatic lapse rate as it sinks. Of course, ample sunshine (remember the long days) and drier than normal surface conditions were important as well, but ultimately this was a hot air mass slowly shifting around Europe that was long lasting (and is continuing at mid-July in many parts of the Mediterranean).
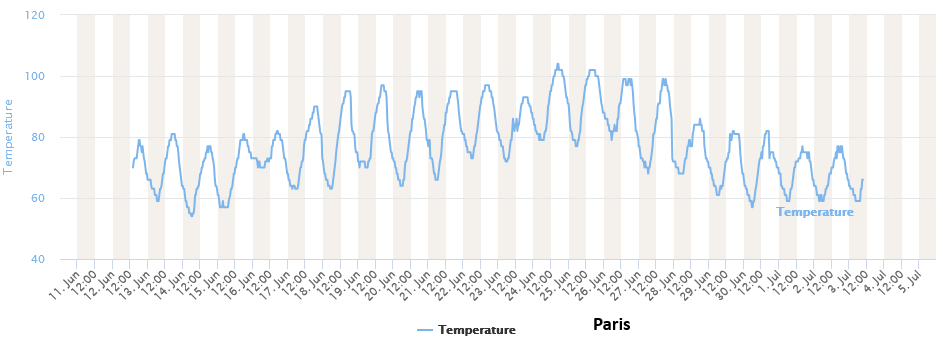
Without too much explanation, let's just sample the time line of a few more observations. First will be Paris, France (Charles de Gaulle Airport), which was consistently hot from 18-27 Jun 2026.
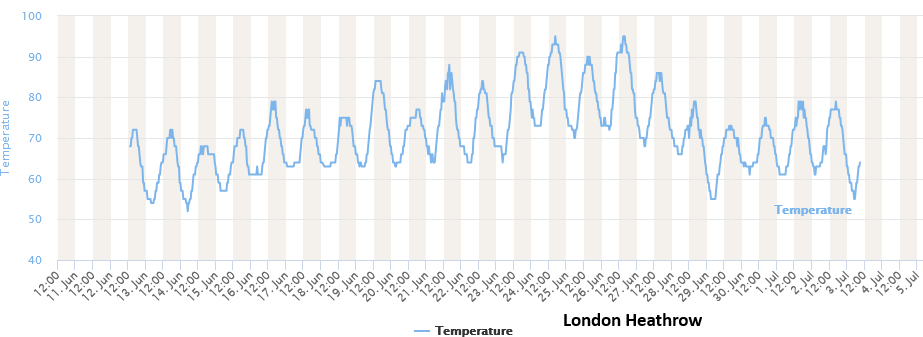
London, England (Heathrow) was more on the northwest periphery of the heat but still had exceptionally hot days from 23-26 Jun 2026.
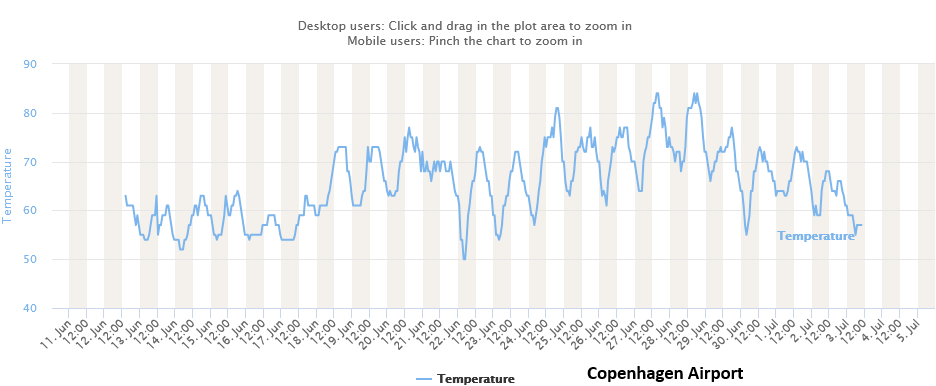
Copenhagen, Denmark had brief extreme heat, with Denmark being at the northern end of the air mass. The graph below was for the airport, where the south wind was modified by the water (so it stayed in the 80s F), though the city itself being a bit farther north did get into the 90s F on 27 Jun 2026. The other Nordic countries remained mostly mild during this period.
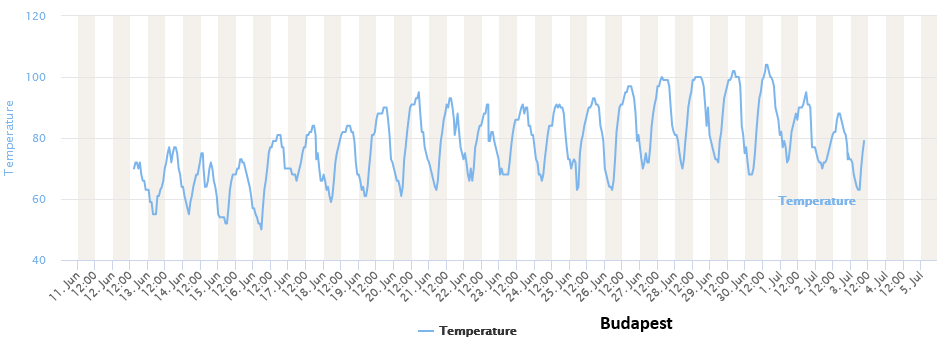
The peak of the heat came a little bit later farther east in Budapest, Hungary on 30 Jun 2026 (though it had been hot since around 20 Jun 2026).
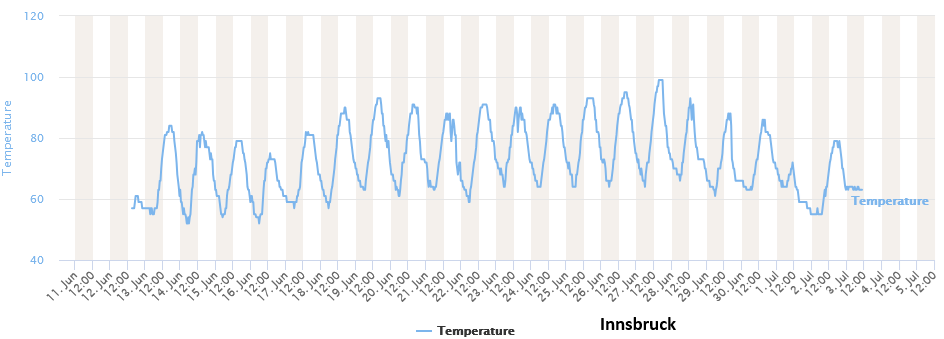
Even Innsbruck, Austria, in the Alps (a little below 600 meters/2000 feet above sea level) almost hit 100 F (average June high is 24 C/75 F).
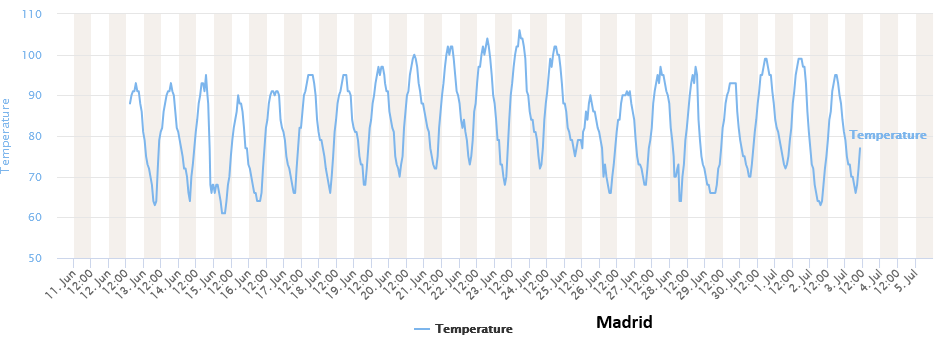
Here's Madrid, Spain, quite consistently hot (just a brief lowering of the temperatures around 25-26 Jun 2026 due to that upper low to the west). It is still hot there as of mid-July.
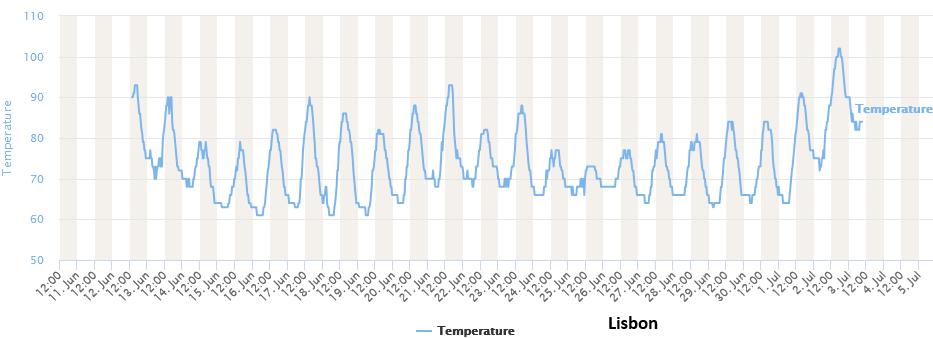
And finally, Lisbon, Portugal, on the western side of the Iberian peninsula had more inconsistent heat as it was cooler when onshore flow from the west prevailed (or under the influence of the upper low), though their hottest weather came in early July (including after the time frame of this graph).
Looking back at the climatology of heat waves in Europe, here is a graphic of the year showing the percentage of locations (between 35°N and 70°N Latitude and 10°W and 40°W Longitude, so basically covering all of Europe west of Russia and some of the adjacent seas and oceanic areas) setting their all-time highest 850 hPa temperature (via the ERA5 record from 1940 to 2026). It's quite clear that more heat waves in Europe have occurred during recent years in June, though 1947 and 1948 were also quite hot.
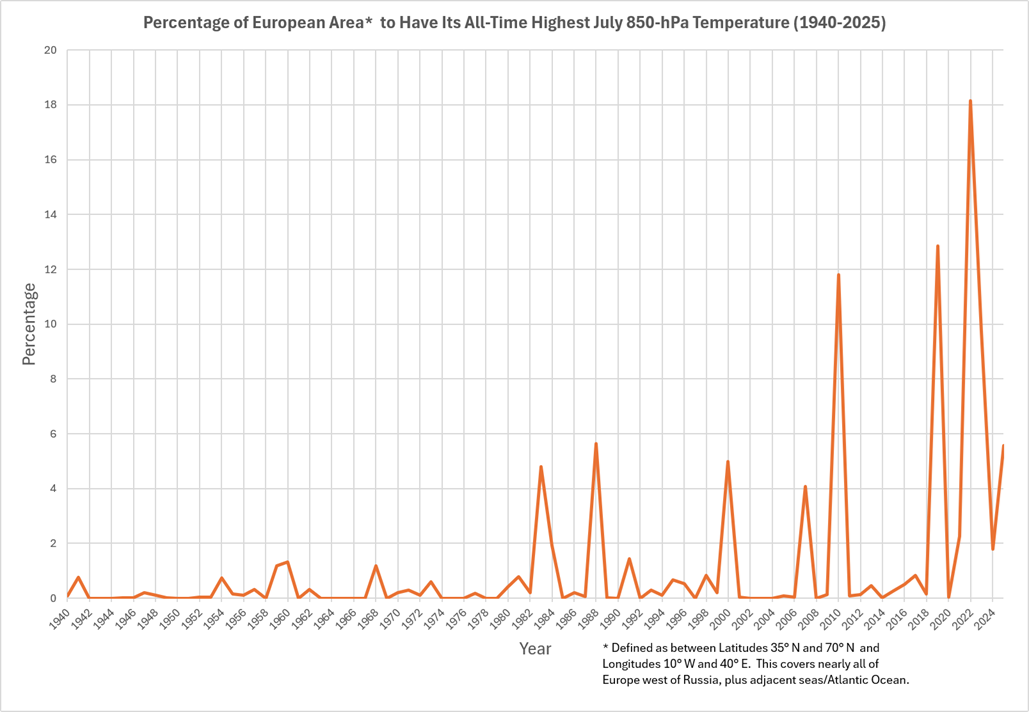
Here is the listing of the top 5 years and their respective percentages of area having the highest June 850 hPa temperature:
Rank       Year         Percentage of All-Time June
                        Record 850 hPa Temperatures

1.         2026                  18.4
2.         2019                  14.5
3.         1948                   8.2
4.         2024                   7.2
5.         1947                   5.3

All other years                  46.4
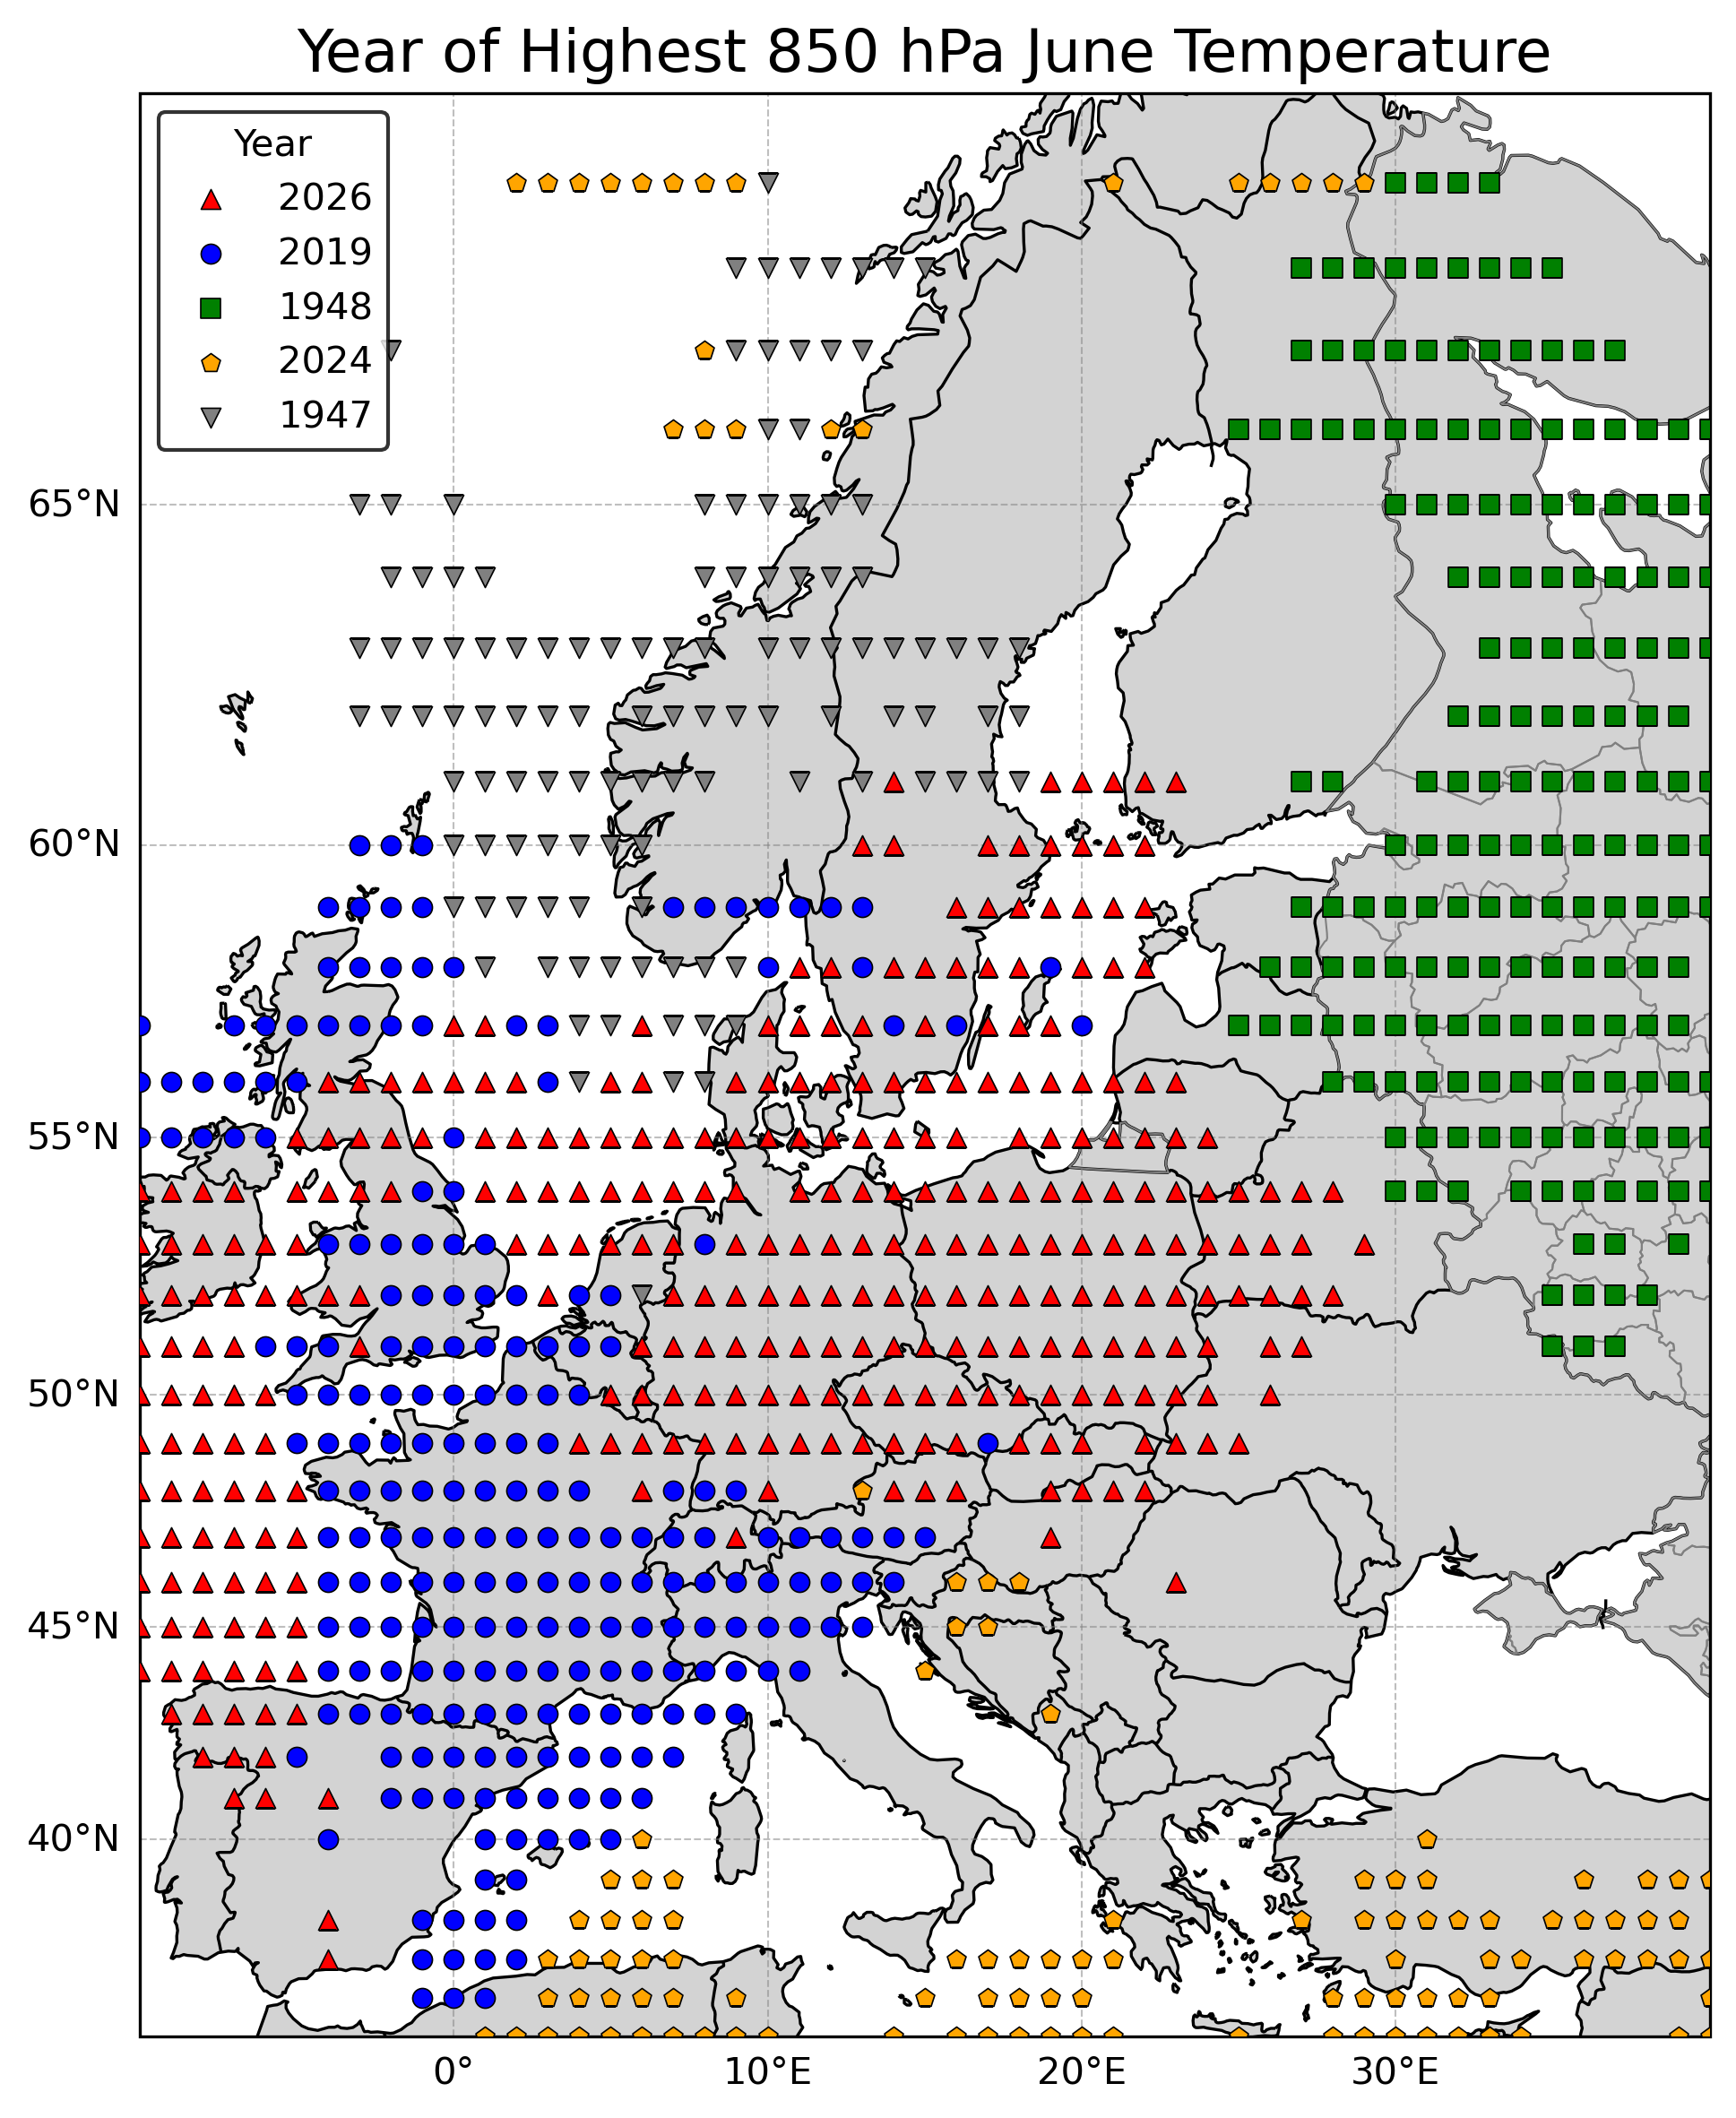
We can now look at the actual locations of the highest 850 hPa temperatures based on year. 2019 and 2026 had a lot of overlap with the extreme heat in 2026 expanding farther east through central Europe. 2024 really wasn't as much of a European heat wave as it was a Mediterranean heat wave (note that the Mercator projection of the map makes this area look smaller due to the more southerly latitude), though there were Nordic areas having extreme heat as well. 1948 was more of a northeastern European event and looks larger on the map due to the Mercator projection. Note that no markers are for where the highest 850 hPa temperatures occurred during a year that is not in the top 5 for June.
July is not much different with heat waves in Europe having become more common in the 21st Century.
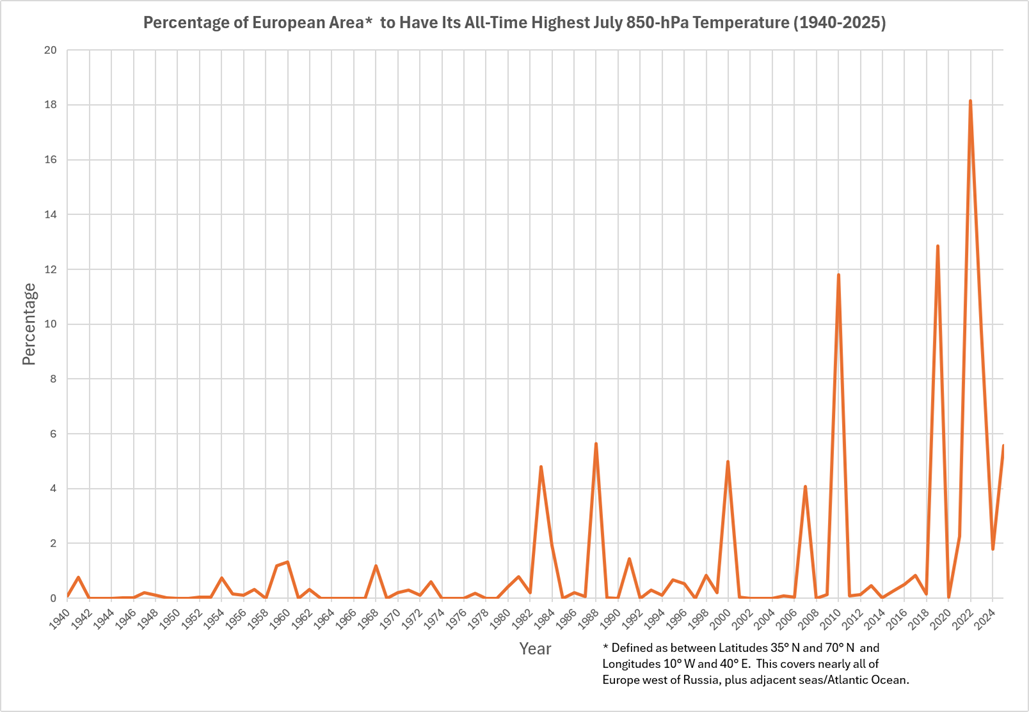
And the listing of the top 5 years and their respective percentages of area having the highest July 850 hPa temperature:
Rank       Year         Percentage of All-Time July
                        Record 850 hPa Temperatures

1.         2022                  18.1
2.         2019                  12.9
3.         2010                  11.8
4.         2023                   9.8
5.         1988                   5.6

All other years                  41.8
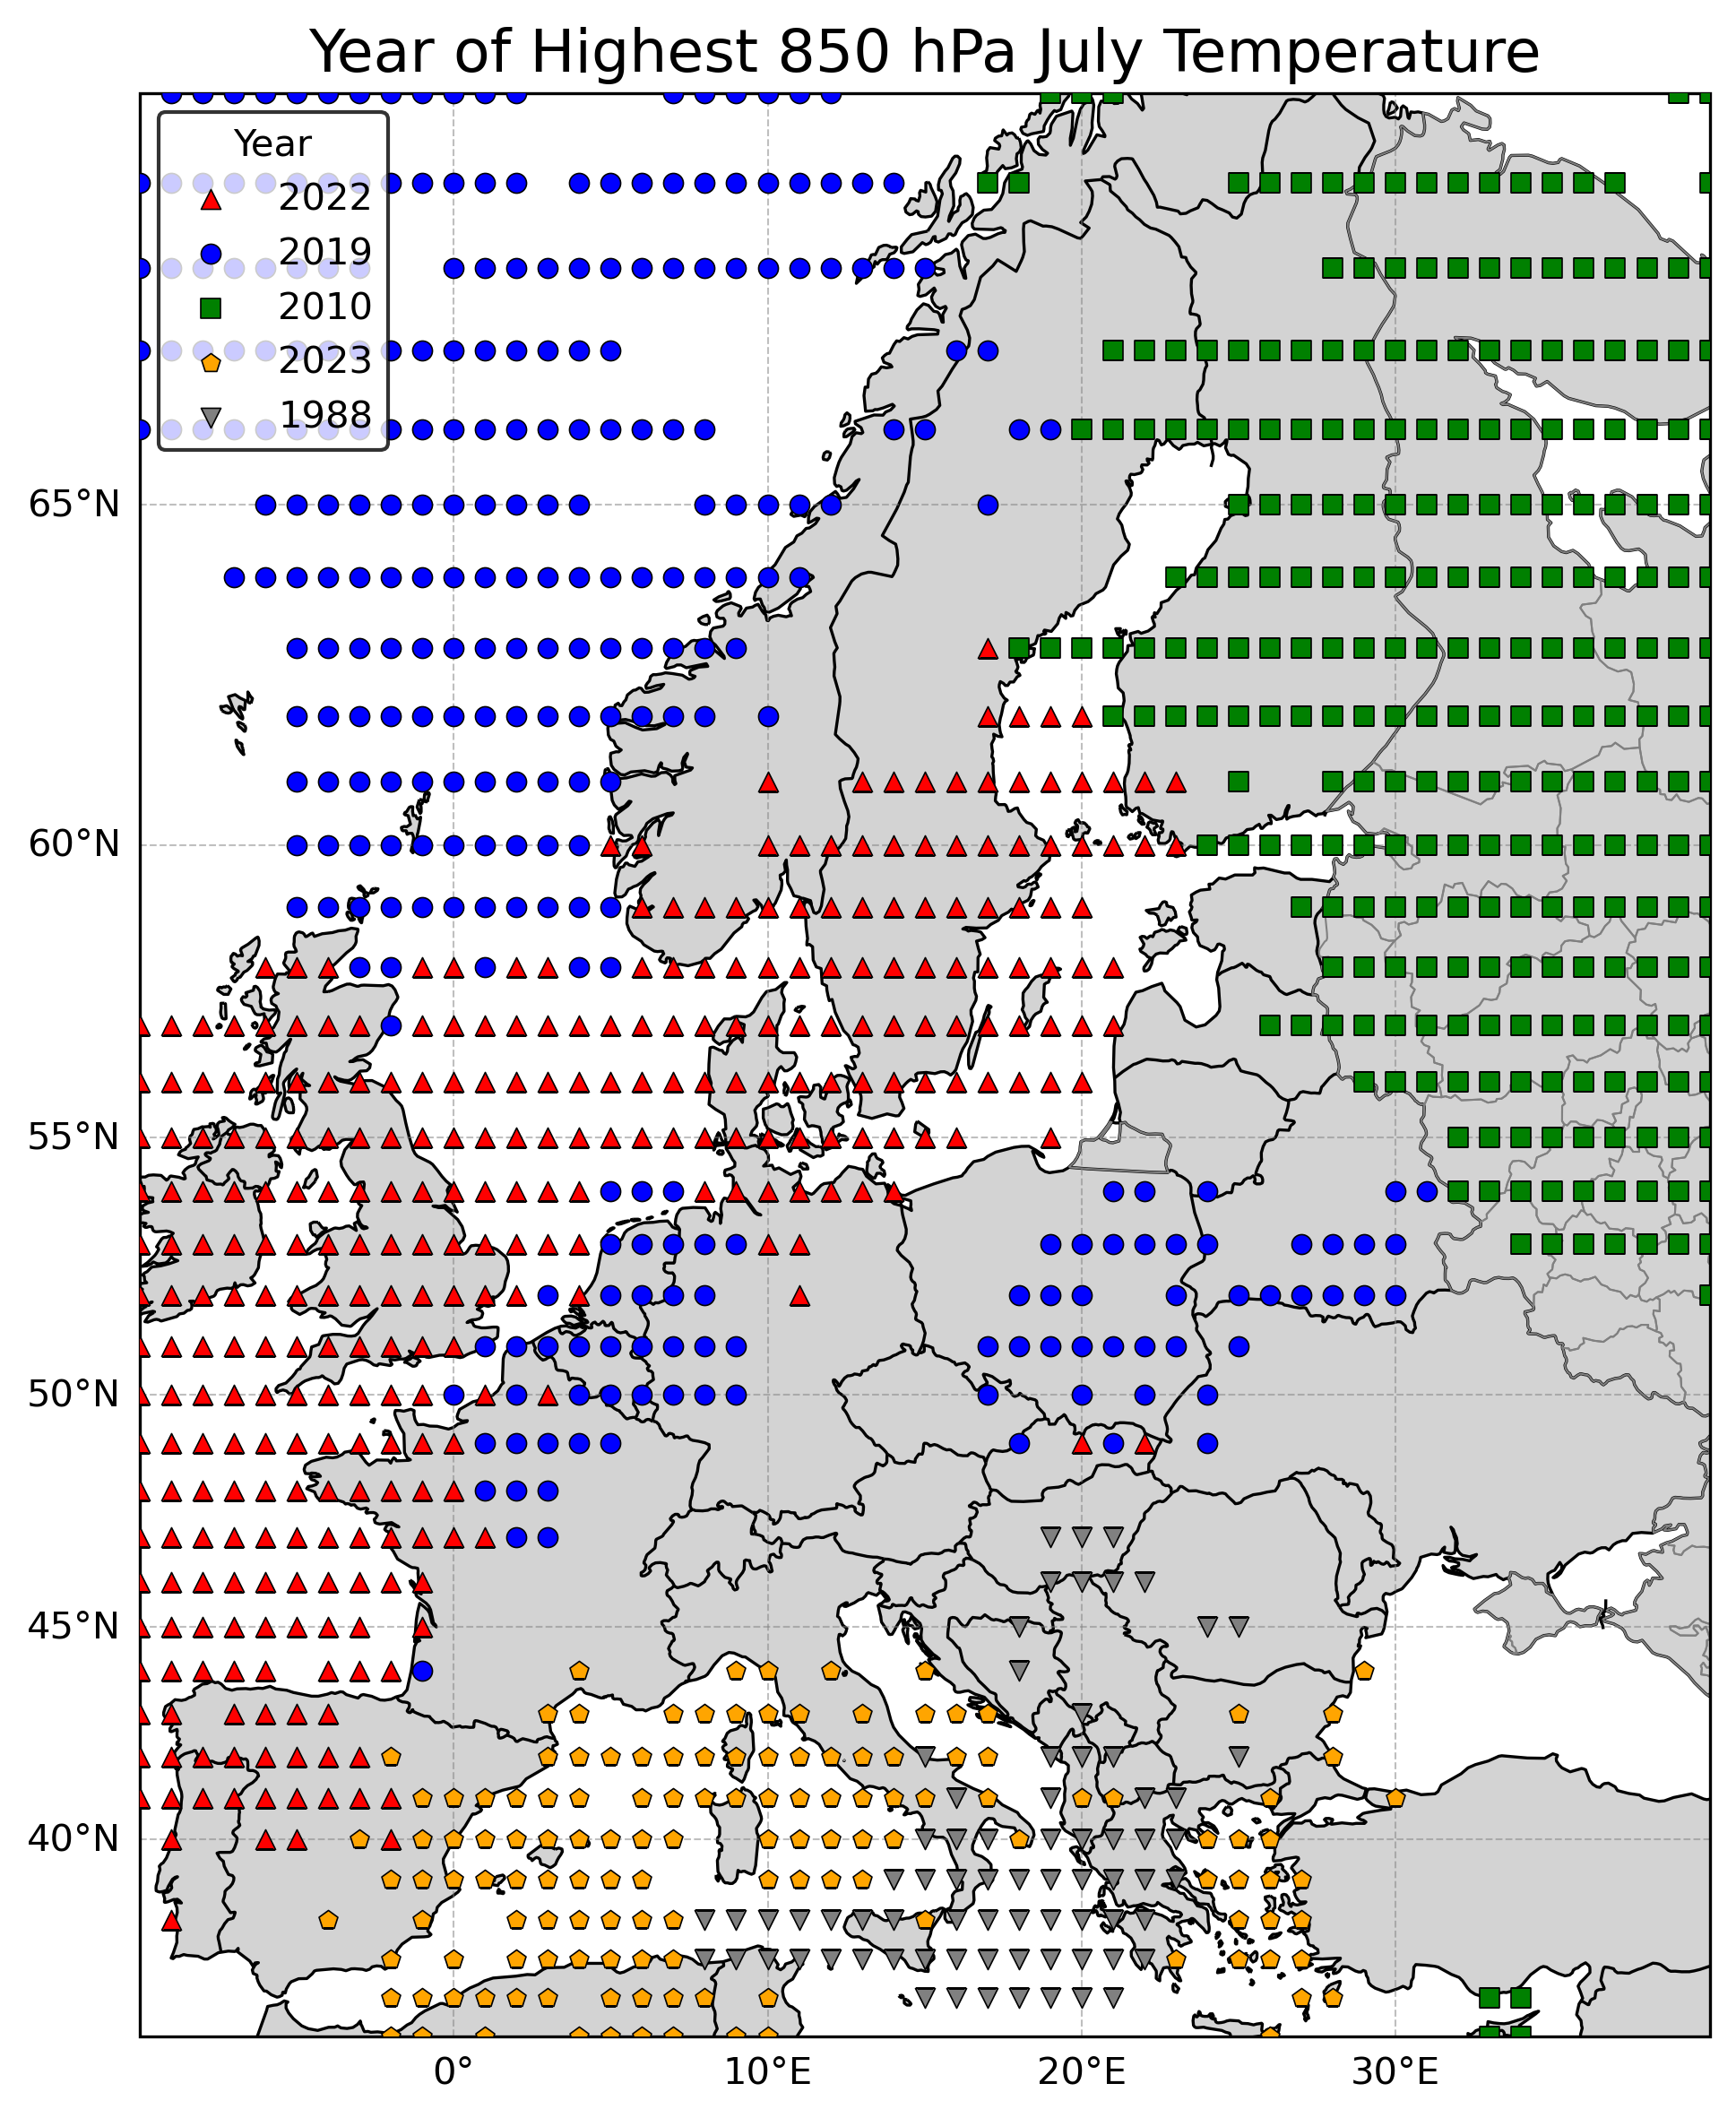
The corresponding map showing the year based on location for the highest 850 hPa temperatures in July shows the 2019 and 2022 events focused more on the northwest, while July 2010 had a northeastern Europe focus. July 2023, and to an extent, July 1988 had the heat focused on the Mediterranean.
One might ask "The dataset only goes back to 1940. Are you ignoring the hot 1930s?" The 1930s had some hot summers in parts of Europe (especially 1933; I think that summer would have had a spike in the 850 hPa temperature records for July, and there were some other years that hit European parts of Russia with a lot of heat), in addition to the infamous heat waves (mainly 1934 and 1936 but also 1937) in North America. However, global average temperatures were about 1°C/2°F lower then than they are now, and the anomalous heat was mostly restricted to parts of North America and Europe in the 1930s and not accompanied by large areas of extreme heat elsewhere.
There is a lot more to see with this heat wave, but I'll stop here for now. June 2026 was had a lot of hot days in many parts of western, central and southern Europe (plus warm nights, which I didn't specifically study here), and these sorts of heat waves are clearly becoming more common as we progress through the 21st Century.
Come back soon for analyses of weather and climate, anywhere from California to other parts of the US to around the world!
Some of the future topics will include:
The wettest atmospheres in the world (based on "precipitable water")
Timberlines (highest elevation that trees can grow in a mountain range) and climate
Maximum precipitation rates reported given a certain temperature
Case studies of unusual storms